Jae-Kyun Ryu1,2 and Jang-Yeon Park2,3,4
1Biomedical Institute for Convergence at SKKU, Sungkyunkwan University, Suwon, Korea, Republic of, 2Center for Neuroscience Imaging Research, Institute for Basic Science, Suwon, Korea, Republic of, 3Department of Biomedical Engineering, Sungkyunkwan University, Suwon, Korea, Republic of, 4Department of Intelligent Precision Healthcare Convergence, Sungkyunkwan University, Suwon, Korea, Republic of
1Biomedical Institute for Convergence at SKKU, Sungkyunkwan University, Suwon, Korea, Republic of, 2Center for Neuroscience Imaging Research, Institute for Basic Science, Suwon, Korea, Republic of, 3Department of Biomedical Engineering, Sungkyunkwan University, Suwon, Korea, Republic of, 4Department of Intelligent Precision Healthcare Convergence, Sungkyunkwan University, Suwon, Korea, Republic of
ERASE sequence showed better tSNR than 2D and 3D GE-EPI, whereas it provided
intermediate SNR between them. ERASE showed less physiological noise
contribution (σP/σ0
and l)
than both 2D and 3D GE-EPI.
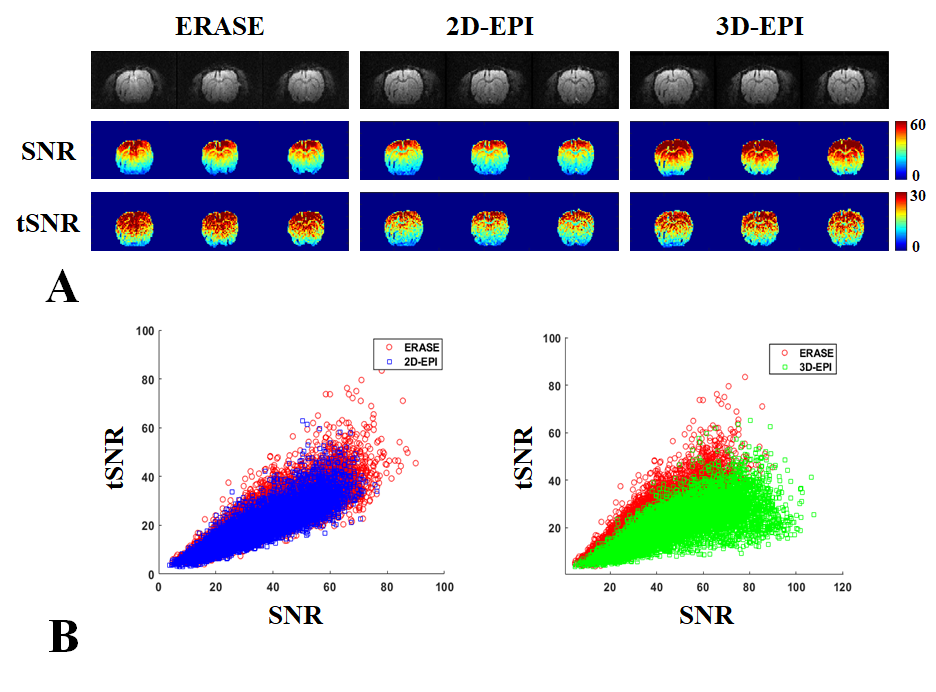
Figure2. (A) show SNR and tSNR maps from
2D/3D-EPI (blue/green squares) and ERASE (red circles) in the color scale range between 0~60 and 0~30. As shown in (B) where
total voxel values of tSNR and SNR were scatter plotted. SNR: signal-to-noise ratio, tSNR: temporal SNR, error bars
by ±
standard error of mean (SEM).
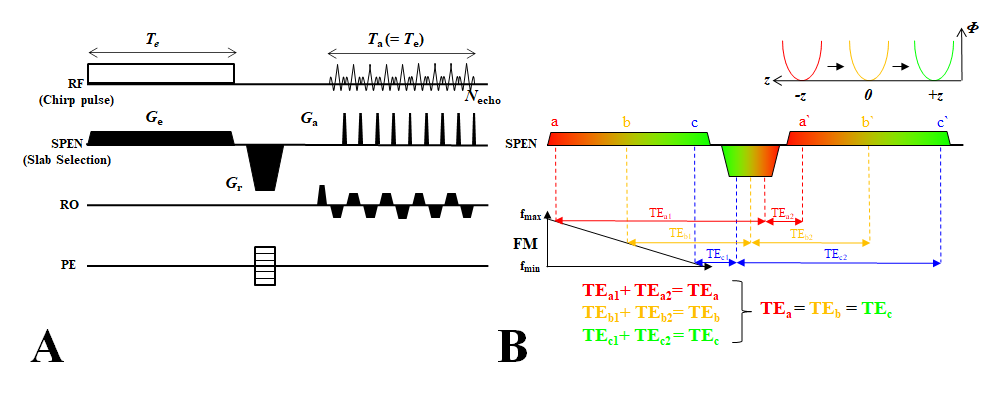
Figure1. ERASE
sequence diagram (A) and schematic
description of its sequential and local excitation and refocusing mechanism in
the SPEN direction (B). In the ERASE
sequence, the excitation duration of the chirp pulse (Te) is
set to be same as total acquisition duration (Ta) and, with a
re-phasing gradient between them, all spins experience constant TE across an
object (B). SPEN is applied for slab encoding in the slab-selective direction.
Ge: excitation gradient, Ga: acquisition
gradient, Gr: re-phasing gradient, RO: read-out, PE: phase-encoding,
FM: frequency-modulation.