Joana Carvalho1, Francisca F. Fernandes1, and Noam Shemesh1
1Champalimaud Centre for the Unknown, Lisbon, Portugal
1Champalimaud Centre for the Unknown, Lisbon, Portugal
Using a tailored set-up we show:1) fMRI-based high-resolution retinotopic maps of multiple structures of the rat visual pathway and 2) that in the visual cortex the receptive field size varies with cortical depth, spiking at layers IV and VI.
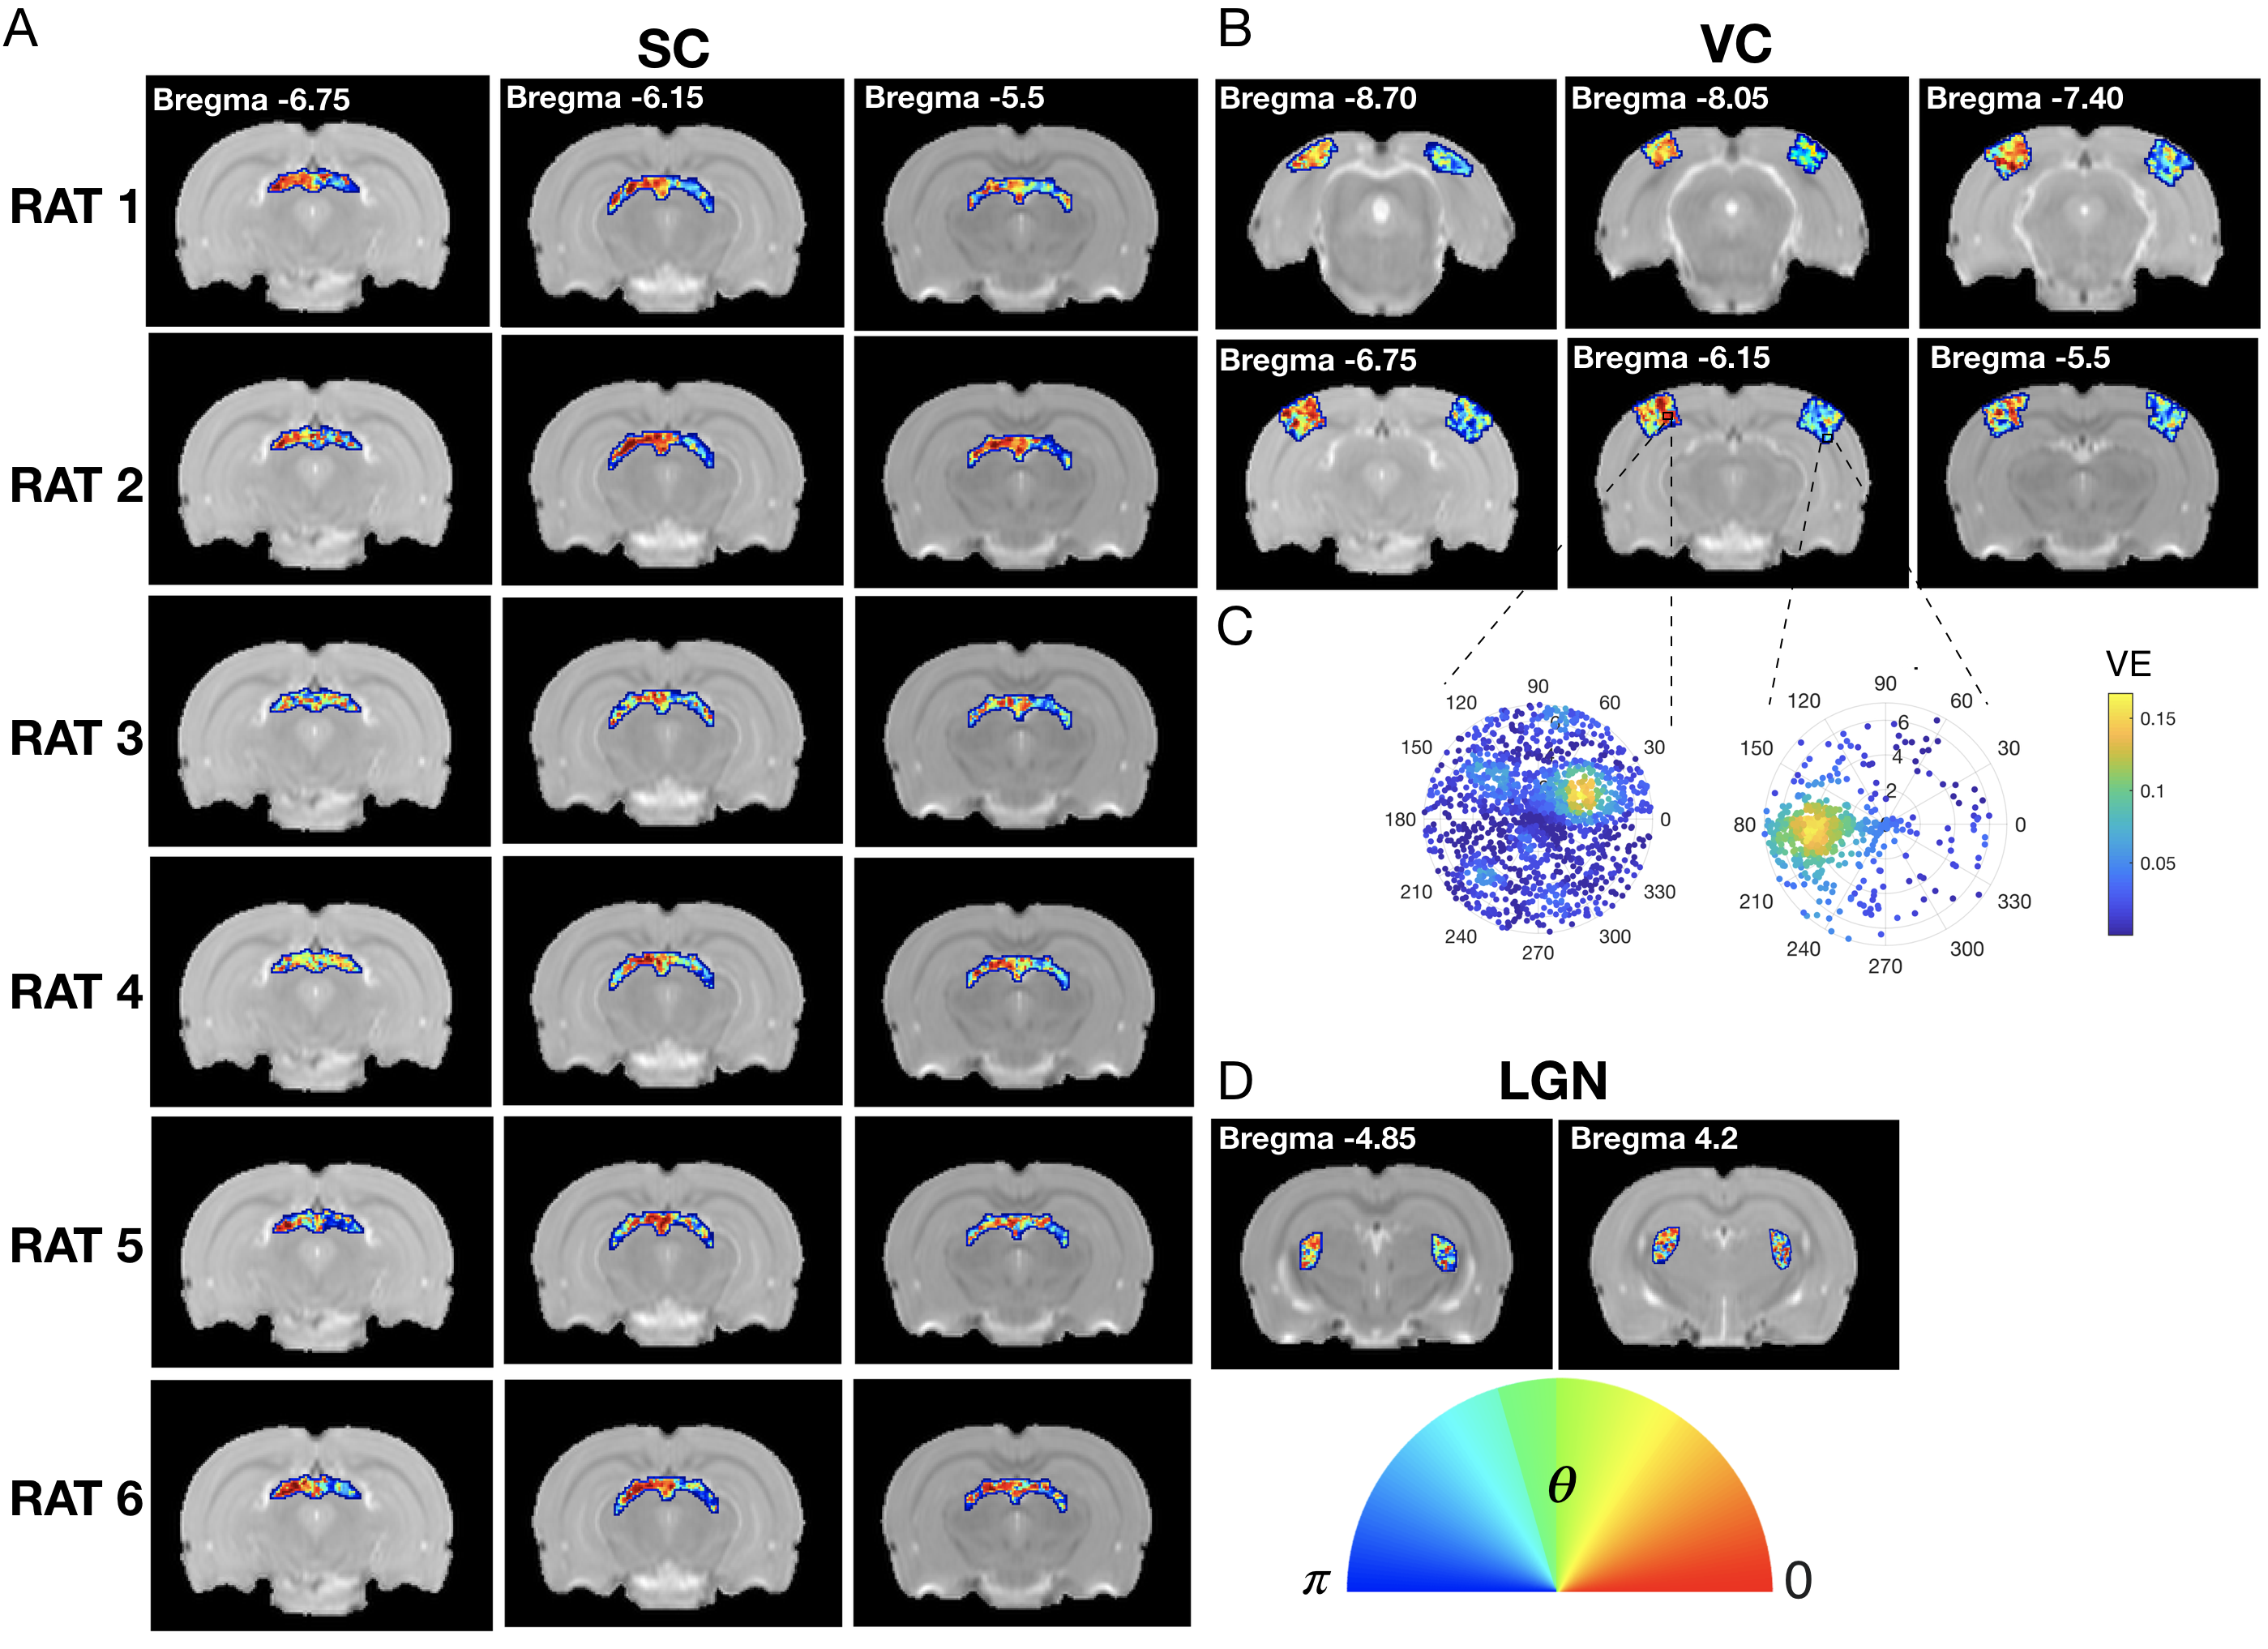
Figure 4 Retinotopic Maps. A: Projection of the RF estimated phase (θ) obtained for the SC for all the animals tested. B: Phase map obtained for the VC of rat 4. C: RF maps of two voxels located in the VC of the left and right hemispheres. D: Phase map obtained for the LGN of rat 4.
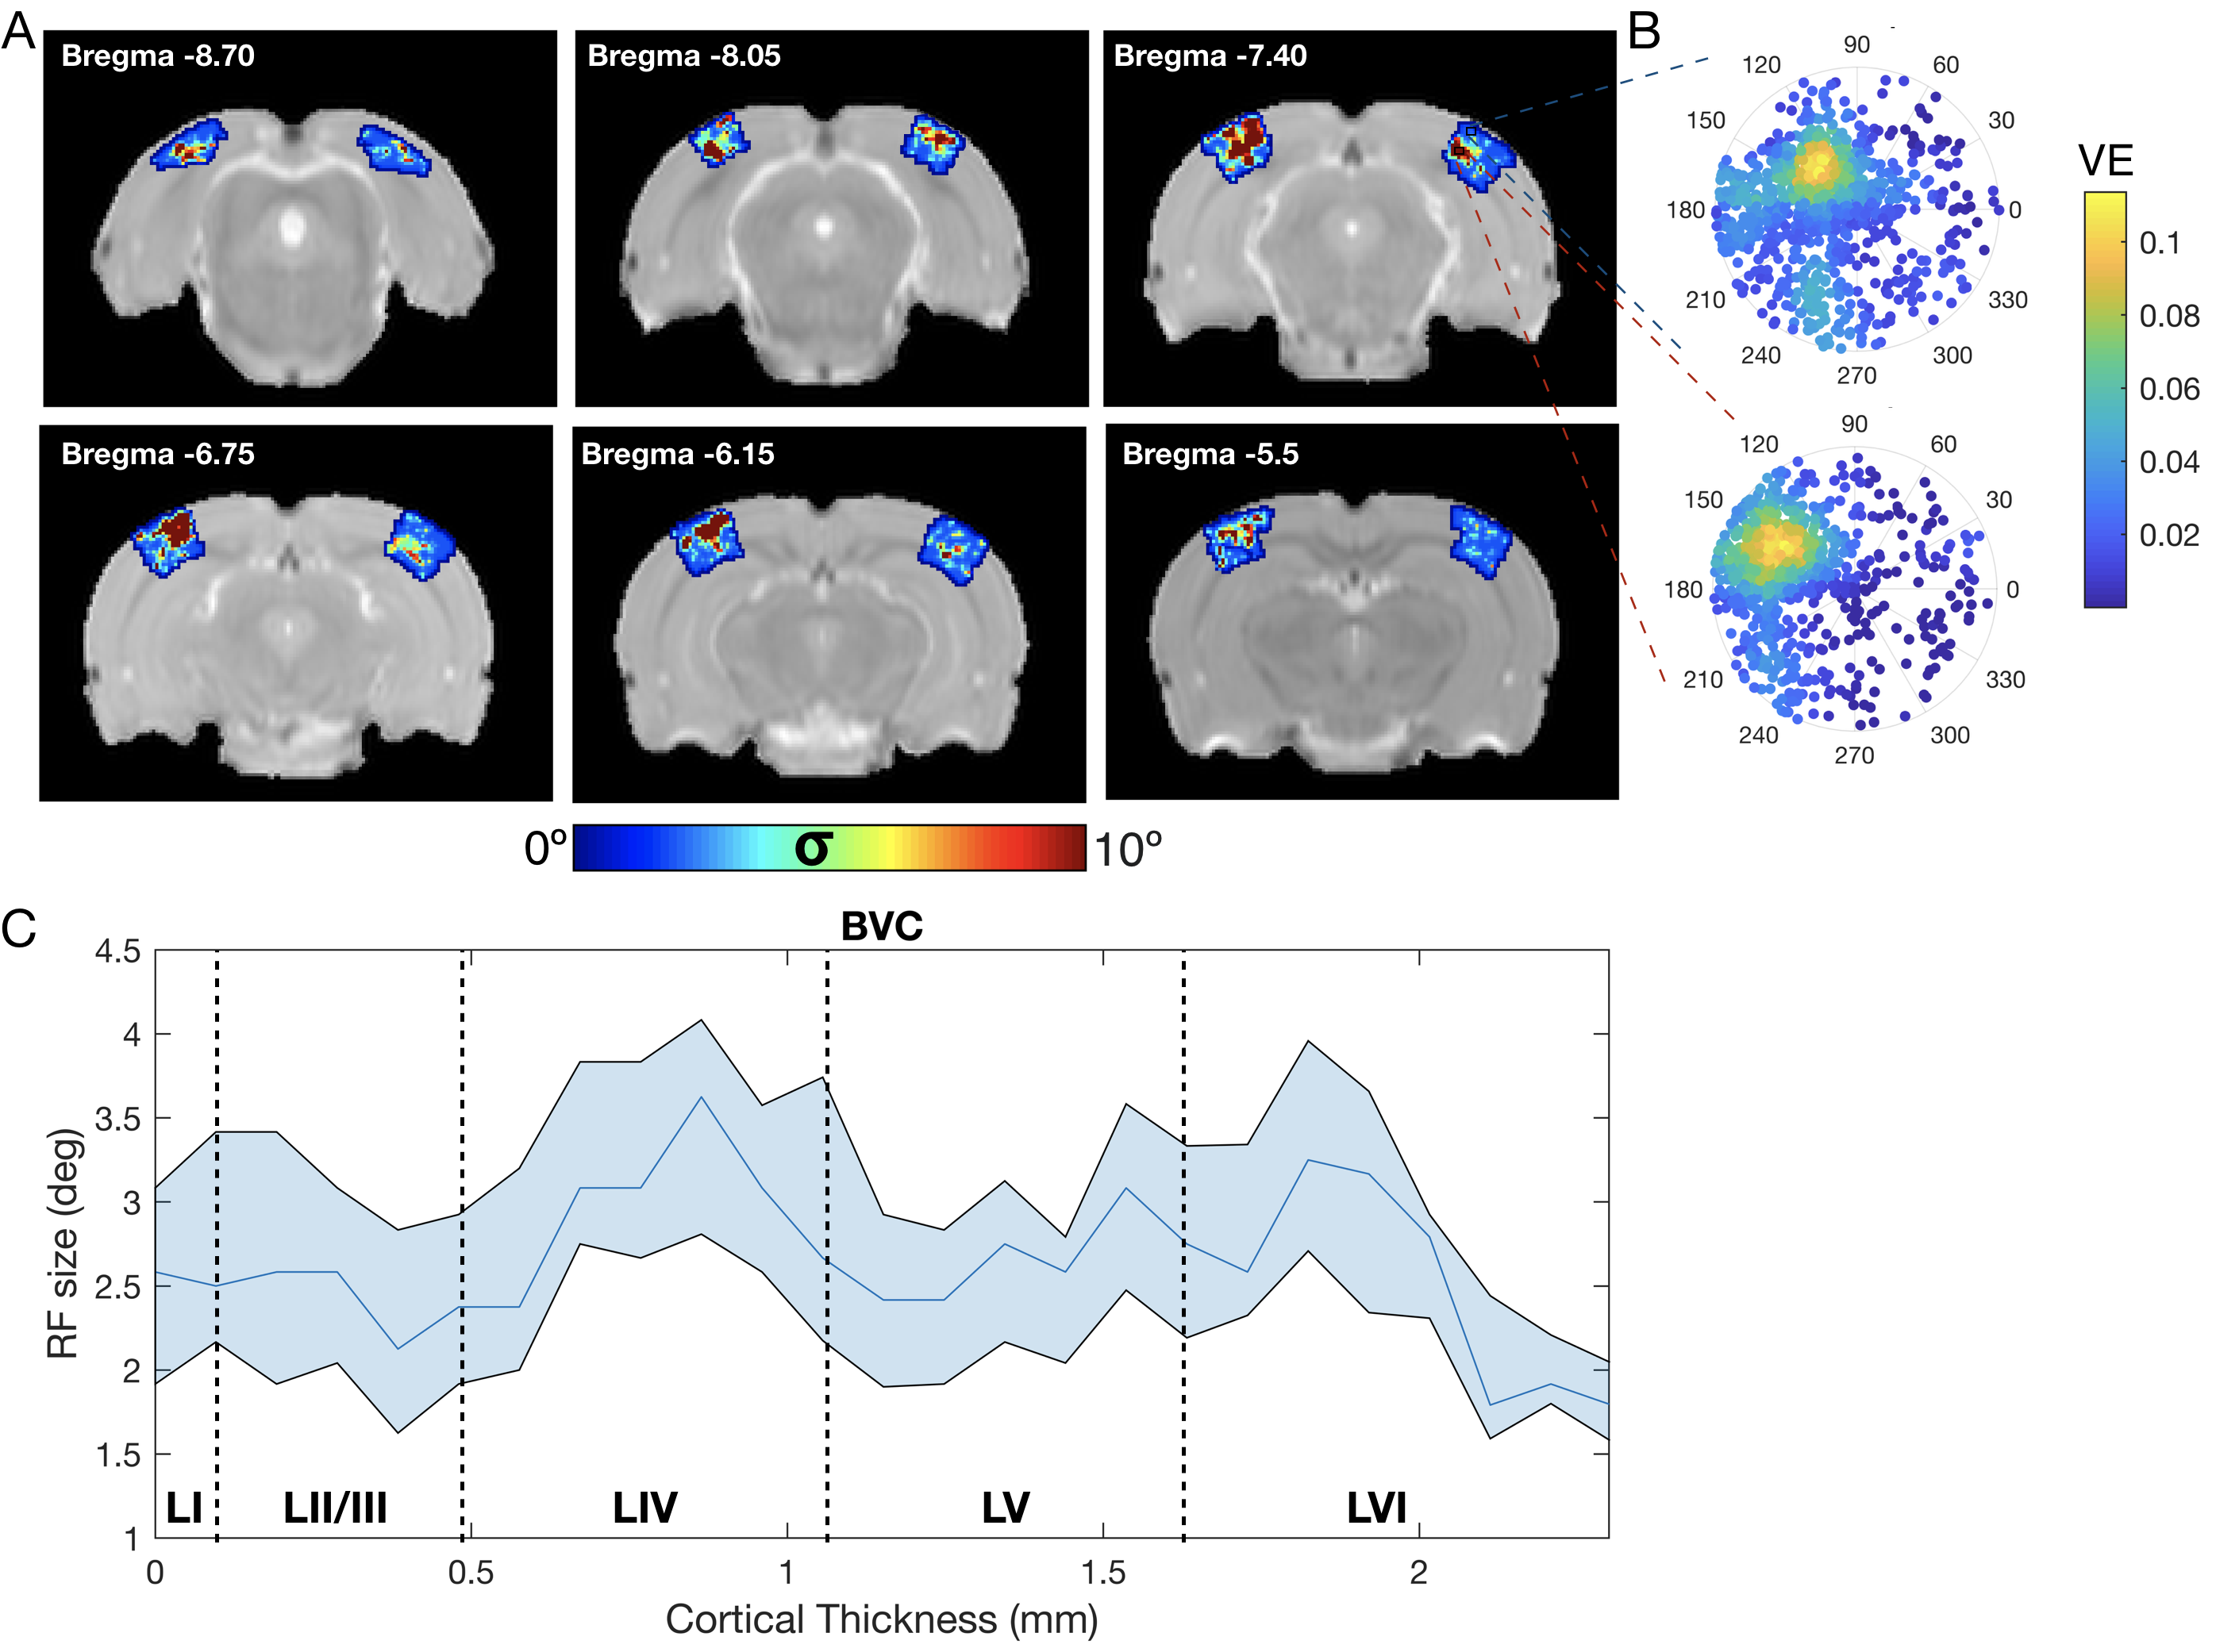
Figure 5. RF size profile across cortical depth. A: Back-projection of the RF size property averaged across animals. The colorbar corresponds to degrees of visual angle. B: Two RF maps obtained for voxels located in Layer LII/III and Layer IV. C: Profile of the RF size across cortical depth, the dashed blue area corresponds to the 95% CI.