Rik Lodevicus Elizabeth Maria Ubaghs1, Roman Böhringer1, Markus Marks1, Mehmet Fatih Yanik1, and Benjamin Friedrich Grewe1
1Institute of Neuroinformatics University and ETH Zurich, Zurich, Switzerland
1Institute of Neuroinformatics University and ETH Zurich, Zurich, Switzerland
We show that stimulus-dependent excitatory/inhibitory processing could explain previous observations in BOLD polarity, and that Somatostatin+neuronal activity is related to a negative inflection in the BOLD signal even when there is a simultaneous increase in excitatory activity.
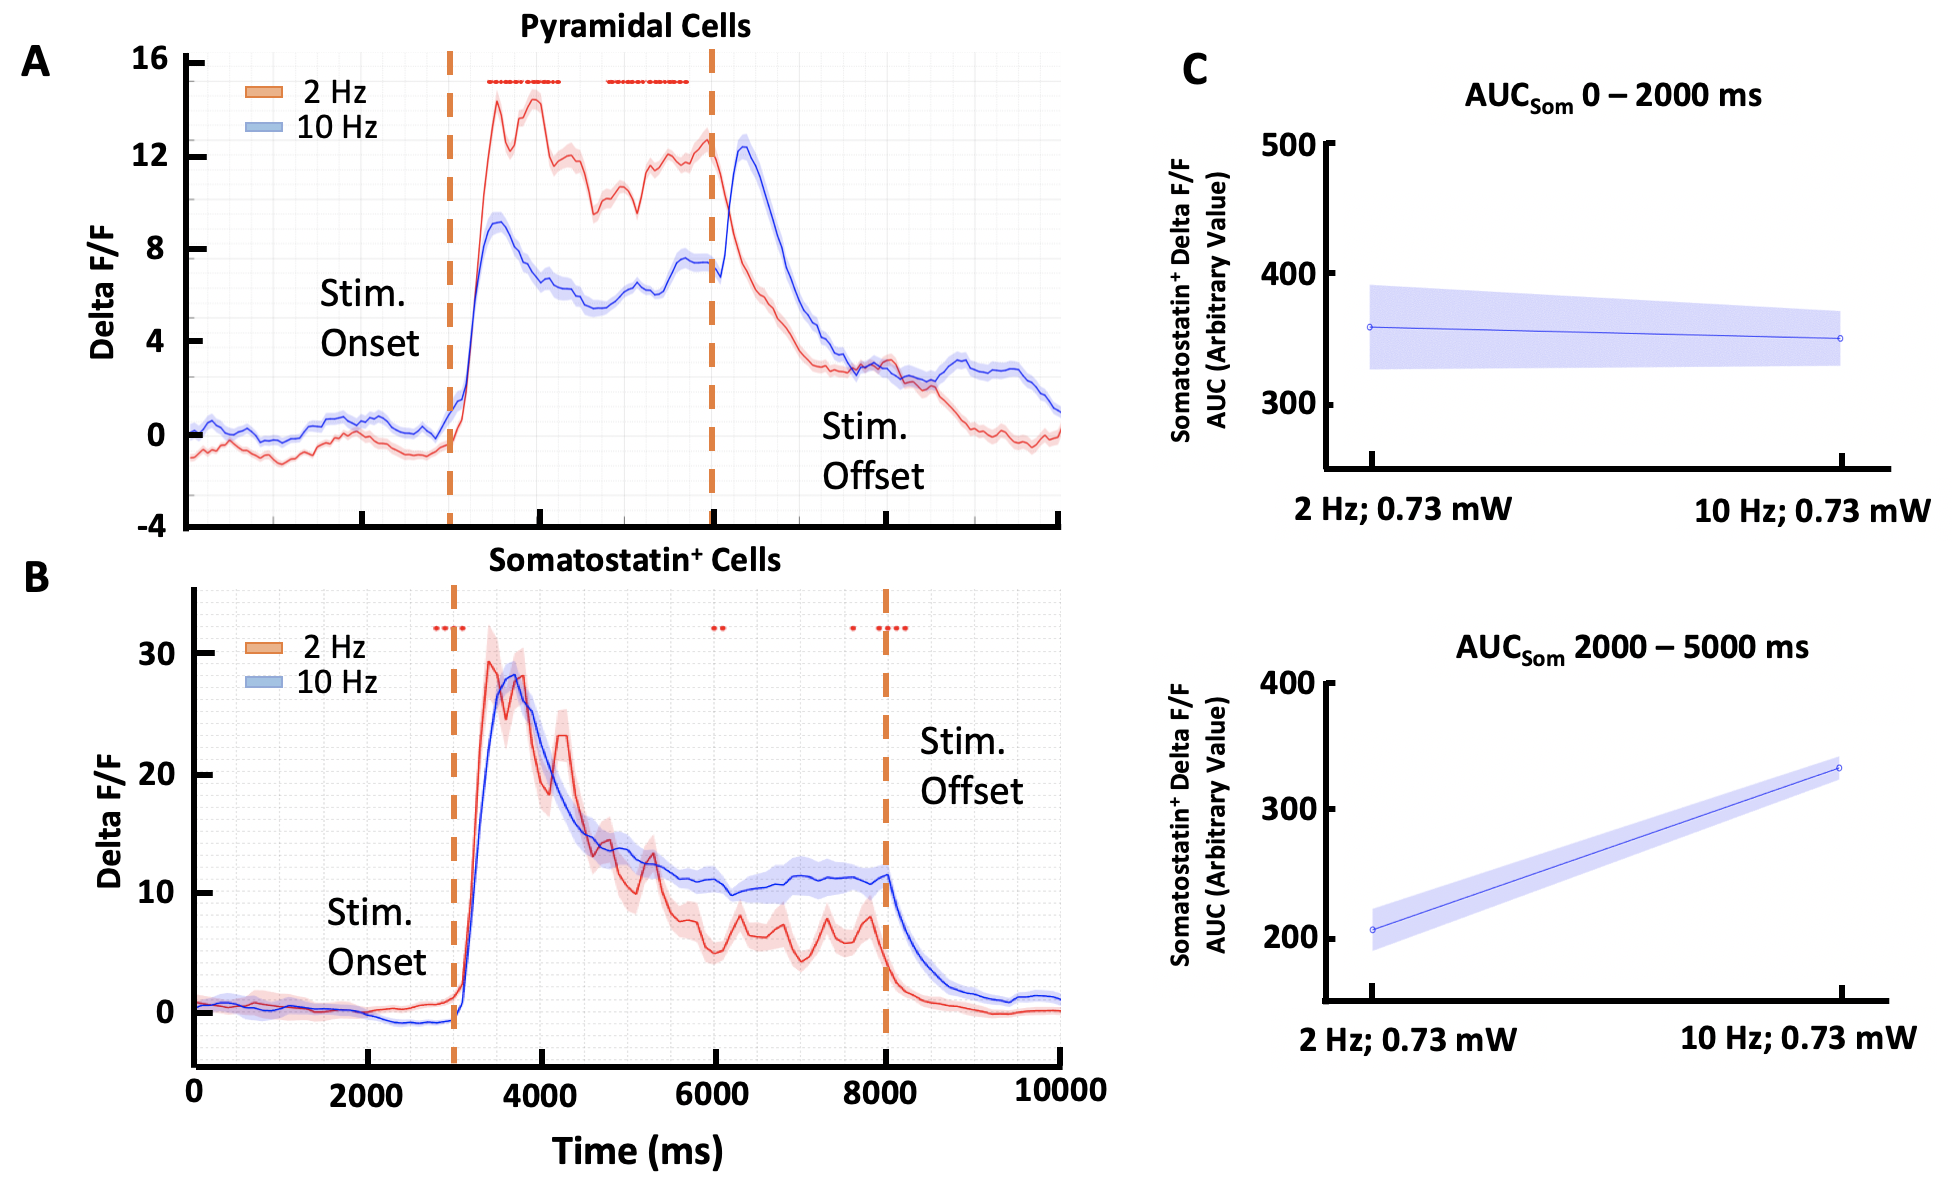
Figure 2 | A) Excitatory pyramidal activity during 2 Hz (peak dF/F = 11.9, mean dF/F = 8.8 with SEM = 2.8) was higher than for 10 Hz stimulation (peak dF/F = 6.9, mean dF/F = 4.7 with SEM = 3.5). B) Inhibitory somatostatin+ neurons showed a similar trend during 2 and 10 Hz stimulation (2 Hz: peak dF/F = 29.4, mean dF/F = 15.7 with SEM = 2.5; 10 Hz: peak dF/F = 28.2, mean dF/F = 17.9 with SEM = 3.1). C) The comparison between the area under the curve (AUC) for the somatostatin+ dF/F for the 2000 – 5000 ms interval is higher during the 2 Hz than the 10 Hz stimulation (Arbitrary value = 205.6 and 341.7 respectively).
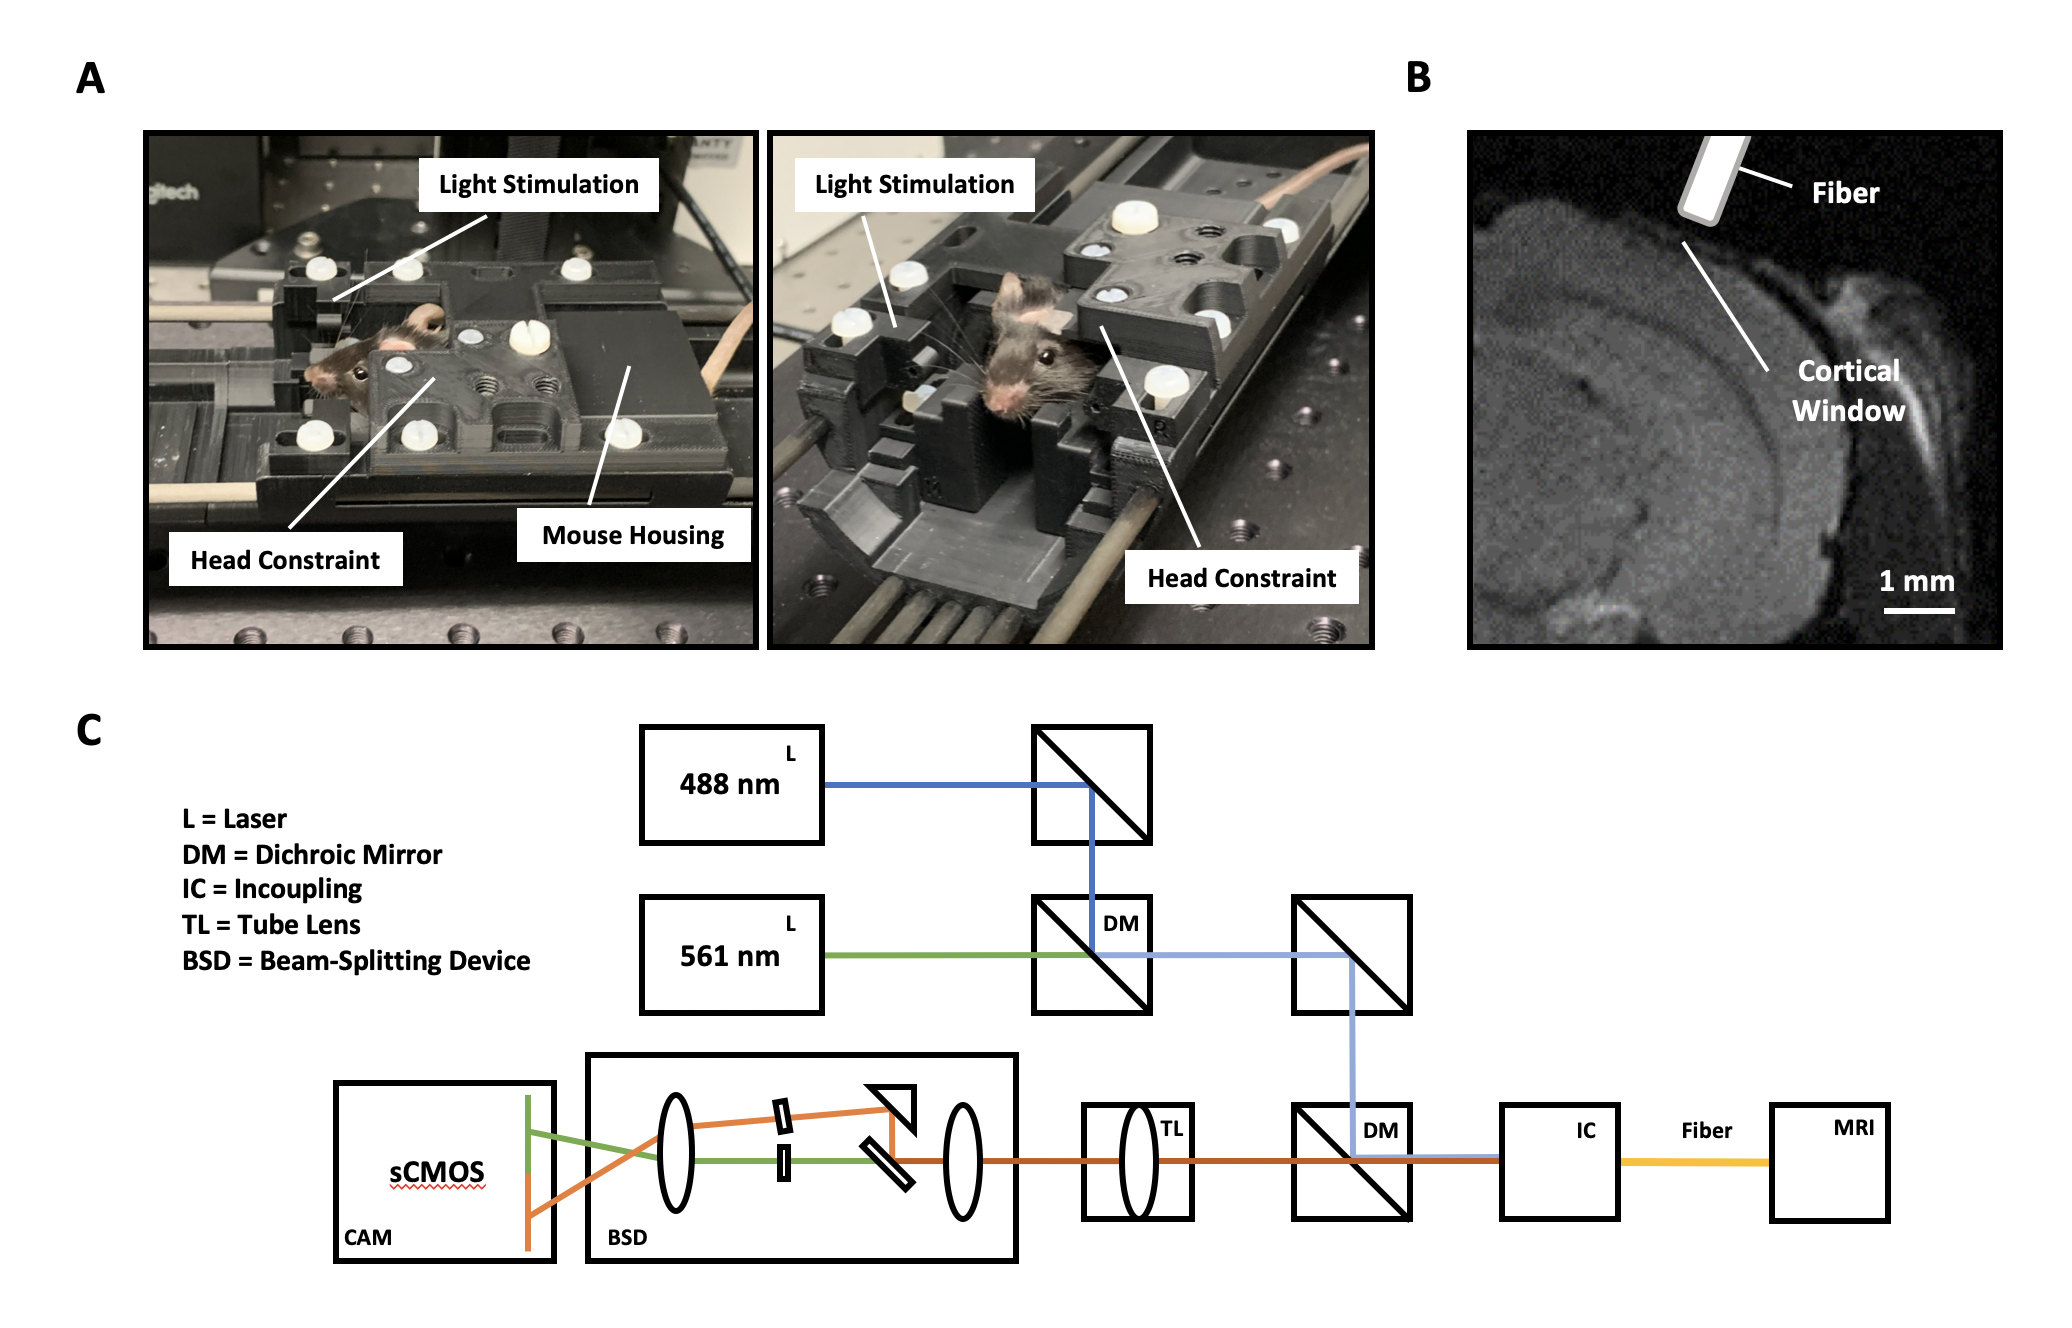
Figure 1 | A) Awake mouse installed in MR cradle with custom developed PEEK headbars. B) MR image of fiber placement on top of a glass cortical window. C) Schematic of the multi-color photometry setup. 488 and 561 nm laser (L) are combined through a dichroic mirror (DM). After combining the excitation lasers the beam is coupled into a fiber. The end of the fiber gets positioned over the cortical window to record Excitatory and Inhibitory cells. The emission gets projected through a tube lens (TL) onto the beam-splitting device (BSD), and recorded on a sCMOS chip (CAM).