Wenwu Sun1, Kelly M. Scheulin2, Sydney E. Sneed2, Madison M. Fagan2, Savannah R. Cheek2, Christina B. Welch2, Morgane E. Golan2, Frankin D. West2, and Qun Zhao1
1Department of Physics and Astronomy, University of Georgia, Athens, GA, United States, 2Regenerative Bioscience Center, University of Geogia, Athens, GA, United States
1Department of Physics and Astronomy, University of Georgia, Athens, GA, United States, 2Regenerative Bioscience Center, University of Geogia, Athens, GA, United States
In this study, sDL and ICA were applied to resting-state fMRI data. Activation maps were generated using group ICA
and group sDL, both with dual regression and permutation test. Consistency was observed through the two methods, indicating functional network
activity changes after injury.
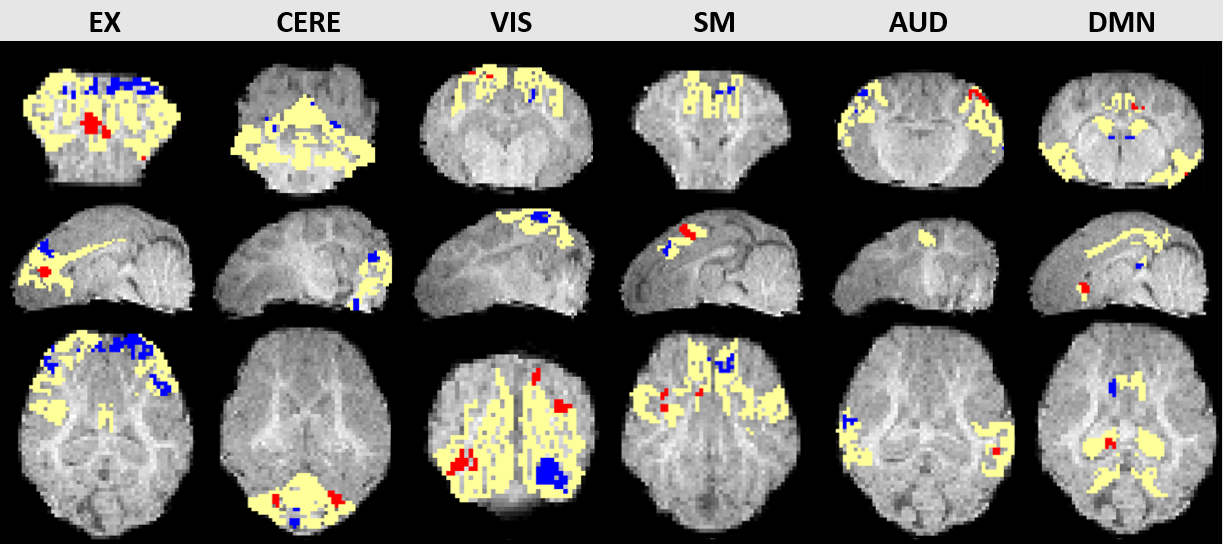
Figure
1: Representative slices for 6 RSNs in coronal (top), sagittal (mid) and axial
(bottom) planes of an ICA trained permutation test result. Red color indicates voxels
with increasing functional activities (D7>D1), while blue color indicates voxels
with decreasing functional activities (D7<D1). Yellow represents the six
corresponding RSN atlas.
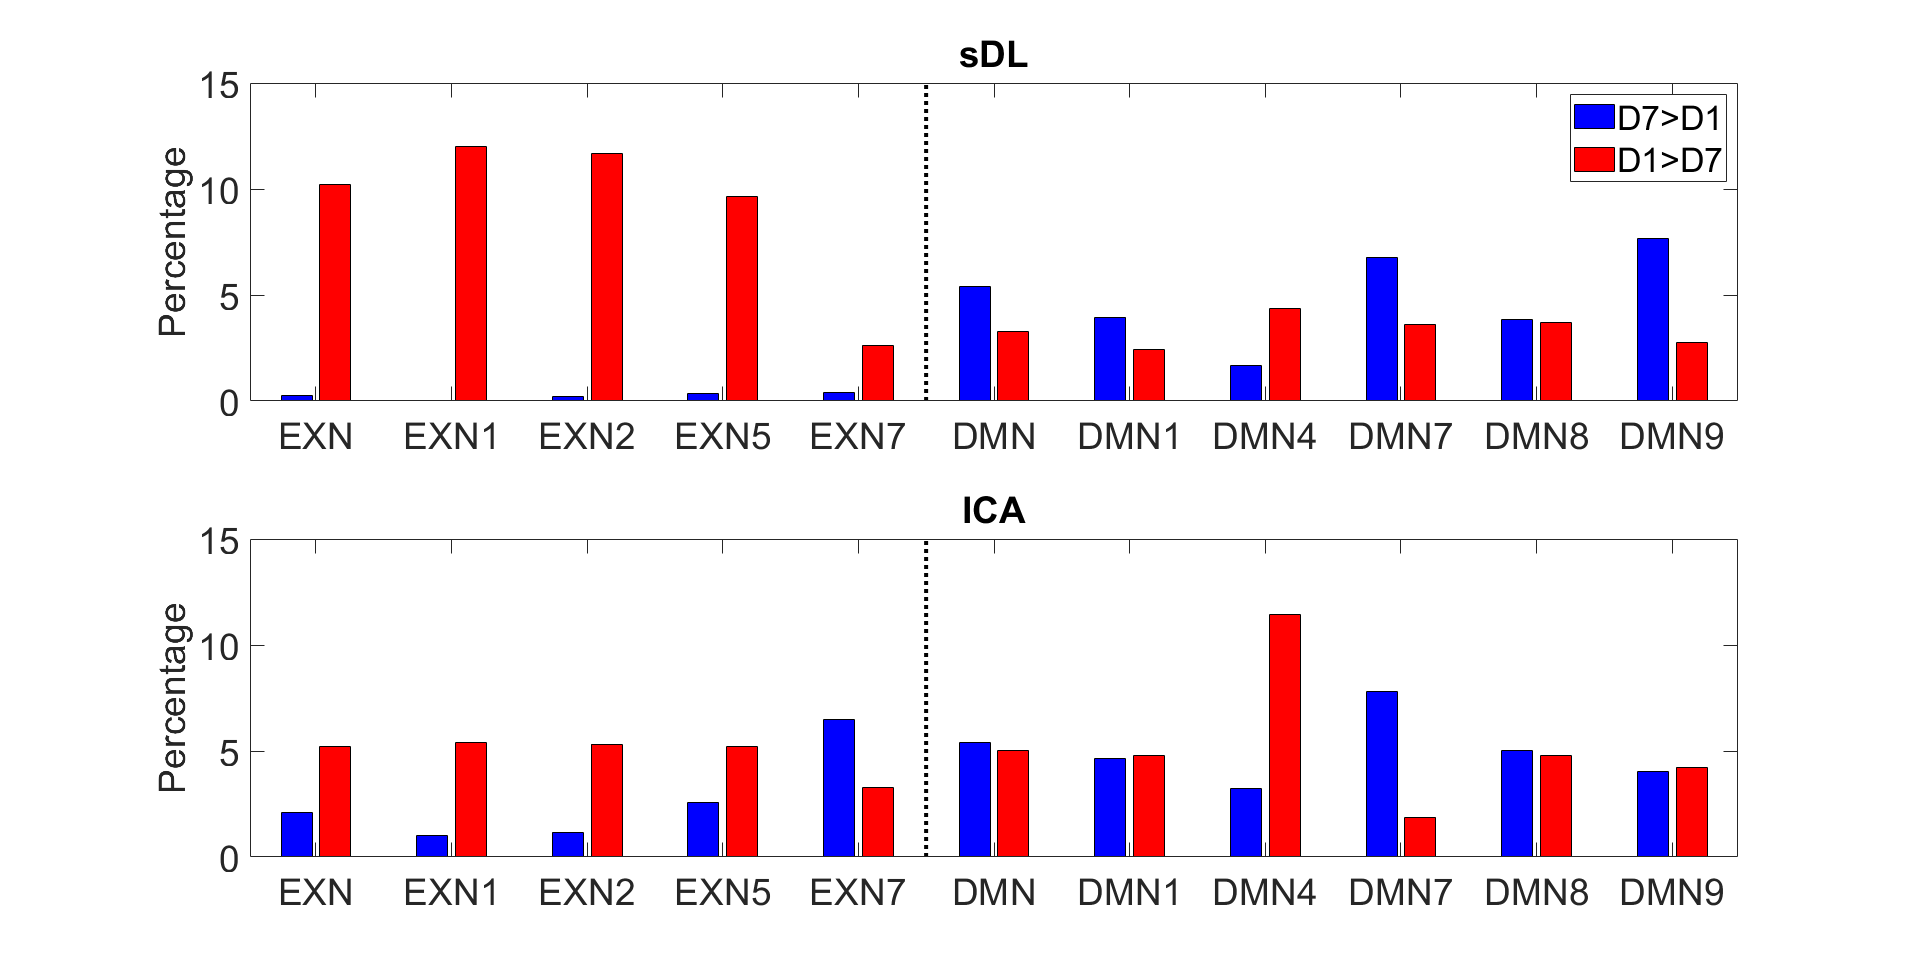
Figure
3: Bar plots of the average of percentages of the significantly
decreasing (blue, D7<D1) and
significantly increasing (red, D7>D1) voxels in EX and DMN network and their
selected subnetworks over 100 voxels for sDL and ICA results. EX4, EX6, DMN2,
DMN3, DMN5 and DMN6 are not shown as these atlases did not contain enough
voxels to reach significance.