Sanam Assili1, Victor Casula1,2, Jaakko Ikäheimo1, Egor Panfilov1, Ari Väärälä1, Martijn A. Cloos3, Riccardo Lattanzi4, and Miika T. Nieminen1,2,5
1Research Unit of Medical Imaging, Physics and Technology, University of Oulu, Oulu, Finland, 2Medical Research Center, University of Oulu and Oulu University Hospital, Oulu, Finland, 3Centre for Advanced Imaging, University of Queensland, Brisbane, Queensland, Australia, 4Center for Advanced Imaging Innovation and Research, New York University Grossman School of Medicine, New York, NY, United States, 5Department of Diagnostic Radiology, Oulu University Hospital, Oulu, Finland
1Research Unit of Medical Imaging, Physics and Technology, University of Oulu, Oulu, Finland, 2Medical Research Center, University of Oulu and Oulu University Hospital, Oulu, Finland, 3Centre for Advanced Imaging, University of Queensland, Brisbane, Queensland, Australia, 4Center for Advanced Imaging Innovation and Research, New York University Grossman School of Medicine, New York, NY, United States, 5Department of Diagnostic Radiology, Oulu University Hospital, Oulu, Finland
In cartilage-mimicking phantoms, MRF-derived T1 and T2 relaxation time
measurements show excellent agreement with conventional relaxation time mapping
techniques. Furthermore, MRF demonstrates topographical variation of T1 and T2
relaxation times typical to human knee cartilage in vivo
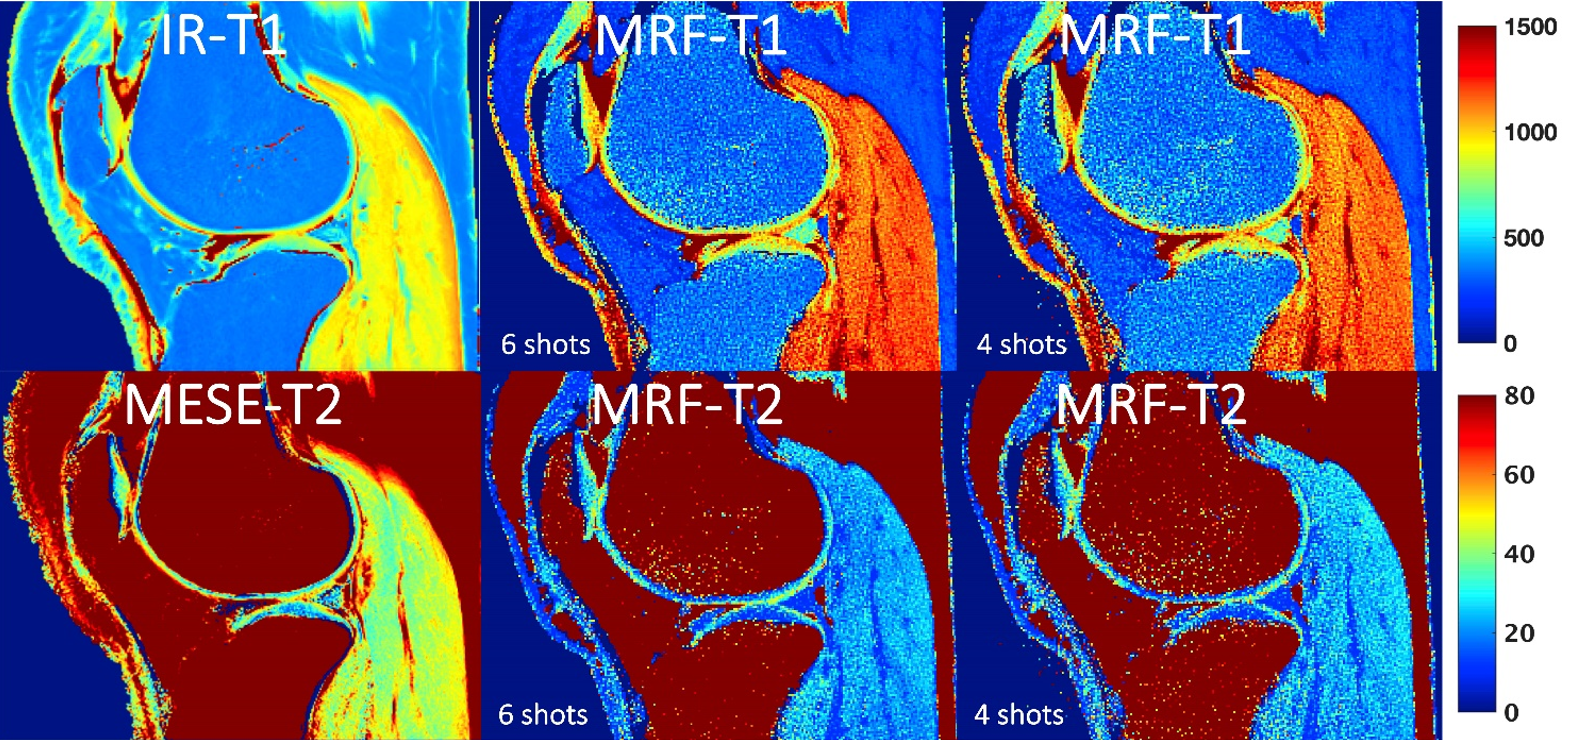
Figure 5. T1 and T2 relaxation time maps from right knee joint
of 34-year-old female obtained with conventional inversion recovery (IR) and
multi-echo spin-echo (MESE) sequences (total time acquisition 26:48 min) and MRF
with 6shot (9:01 min) and 4shots (6:01 min).
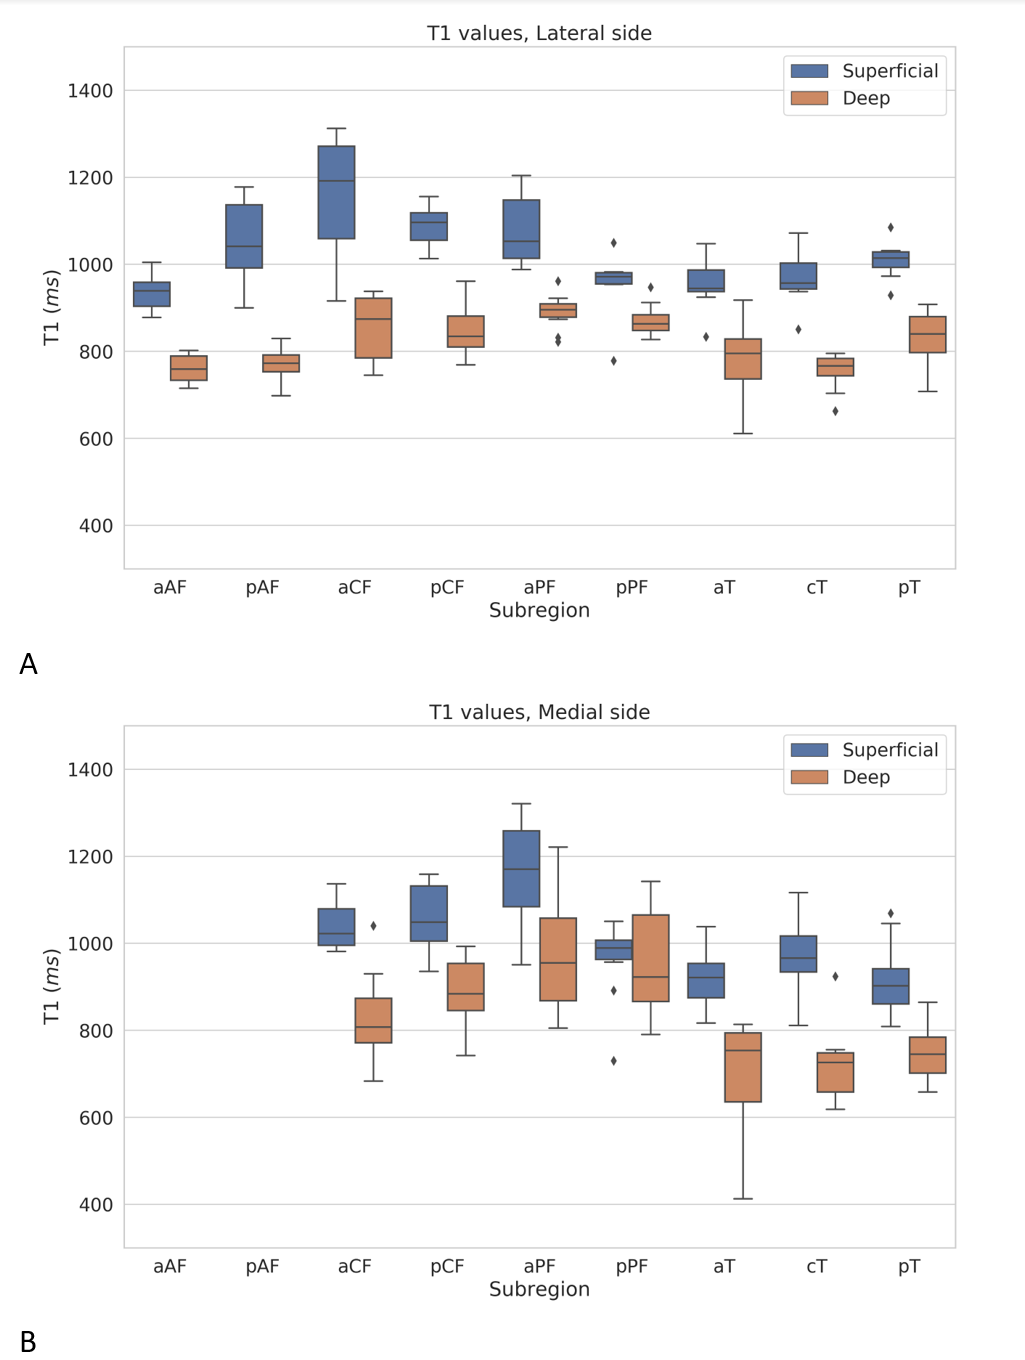
Figure 3. MRF-T1 relaxation times (6shots) of superficial and deep cartilage layers from
lateral (A) and medial (B) tibiofemoral subregions (n=10 knees).