Koren Roach1, Richard Souza1, Sharmila Majumdar1, and Valentina Pedoia1
1UCSF, San Francisco, CA, United States
1UCSF, San Francisco, CA, United States
Deeper layers of acetabular cartilage saw the greatest variation in two-year T1ρ relaxation time changes across healthy subjects and those with early-to-moderate osteoarthritis.
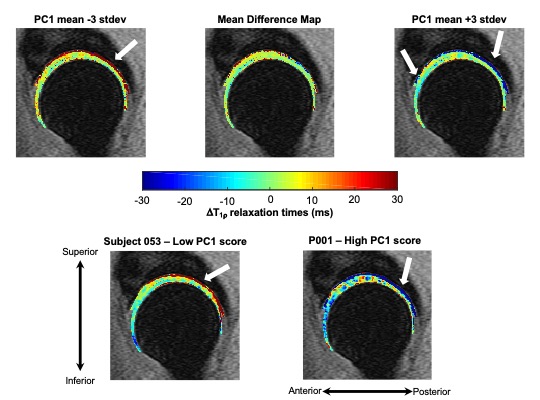
Figure 1: Visualization of principal component (PC) 1 mode of variation along with representative subjects with low and high PC1 scores. PC 1 was primarily characterized by greater two-year changes in T1ρ relaxation times in the deep layers of acetabular cartilage. Top: Mean differences in hip cartilage T1ρ relaxation times over two years across subjects plus or minus 3 standard deviations (stdev) of PC 1 variation. Bottom: Representative subjects with low and high PC 1 scores demonstrate notable changes in the deep layer of acetabular cartilage T1ρ relaxation times over two years.
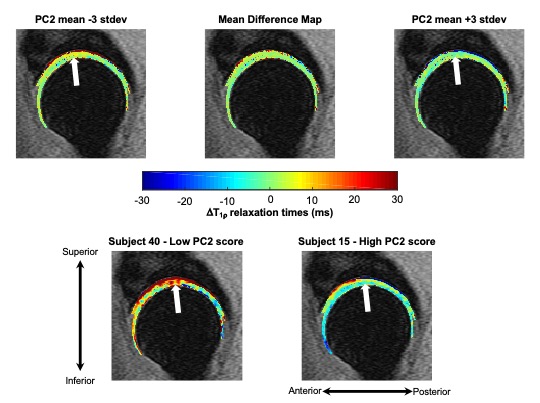
Figure 2: Visualization of principal component (PC) 2 mode of variation along with representative subjects with low and high PC 2 scores. PC 2 was primarily characterized by changes to more superficial layers of the acetabular cartilage in the superior region. Mean differences in hip cartilage T1ρ relaxation times over two years across subjects plus or minus 3 standard deviations (stdev) of PC 2 variation. Representative subjects with low and high PC2 scores demonstrate two-year changes in the superior acetabular cartilage T1ρ relaxation times.