Lauren Watkins1,2, Andrew Schmidt1, Elka Rubin1, Marco Barbieri1, Arjun Desai1,3, Valentina Mazzoli1, Marianne Black1, Garry Gold1,2, Brian Hargreaves1,2,3, Akshay Chaudhari1,4, and Feliks Kogan1
1Radiology, Stanford University, Stanford, CA, United States, 2Bioengineering, Stanford University, Stanford, CA, United States, 3Electrical Engineering, Stanford University, Stanford, CA, United States, 4Biomedical Data Science, Stanford University, Stanford, CA, United States
1Radiology, Stanford University, Stanford, CA, United States, 2Bioengineering, Stanford University, Stanford, CA, United States, 3Electrical Engineering, Stanford University, Stanford, CA, United States, 4Biomedical Data Science, Stanford University, Stanford, CA, United States
There was considerable short-term stability in T2 relaxation times of active, healthy subjects over 5 days and 5 weeks, with lower variability compared to previously reported 5-month and 1-year measures.
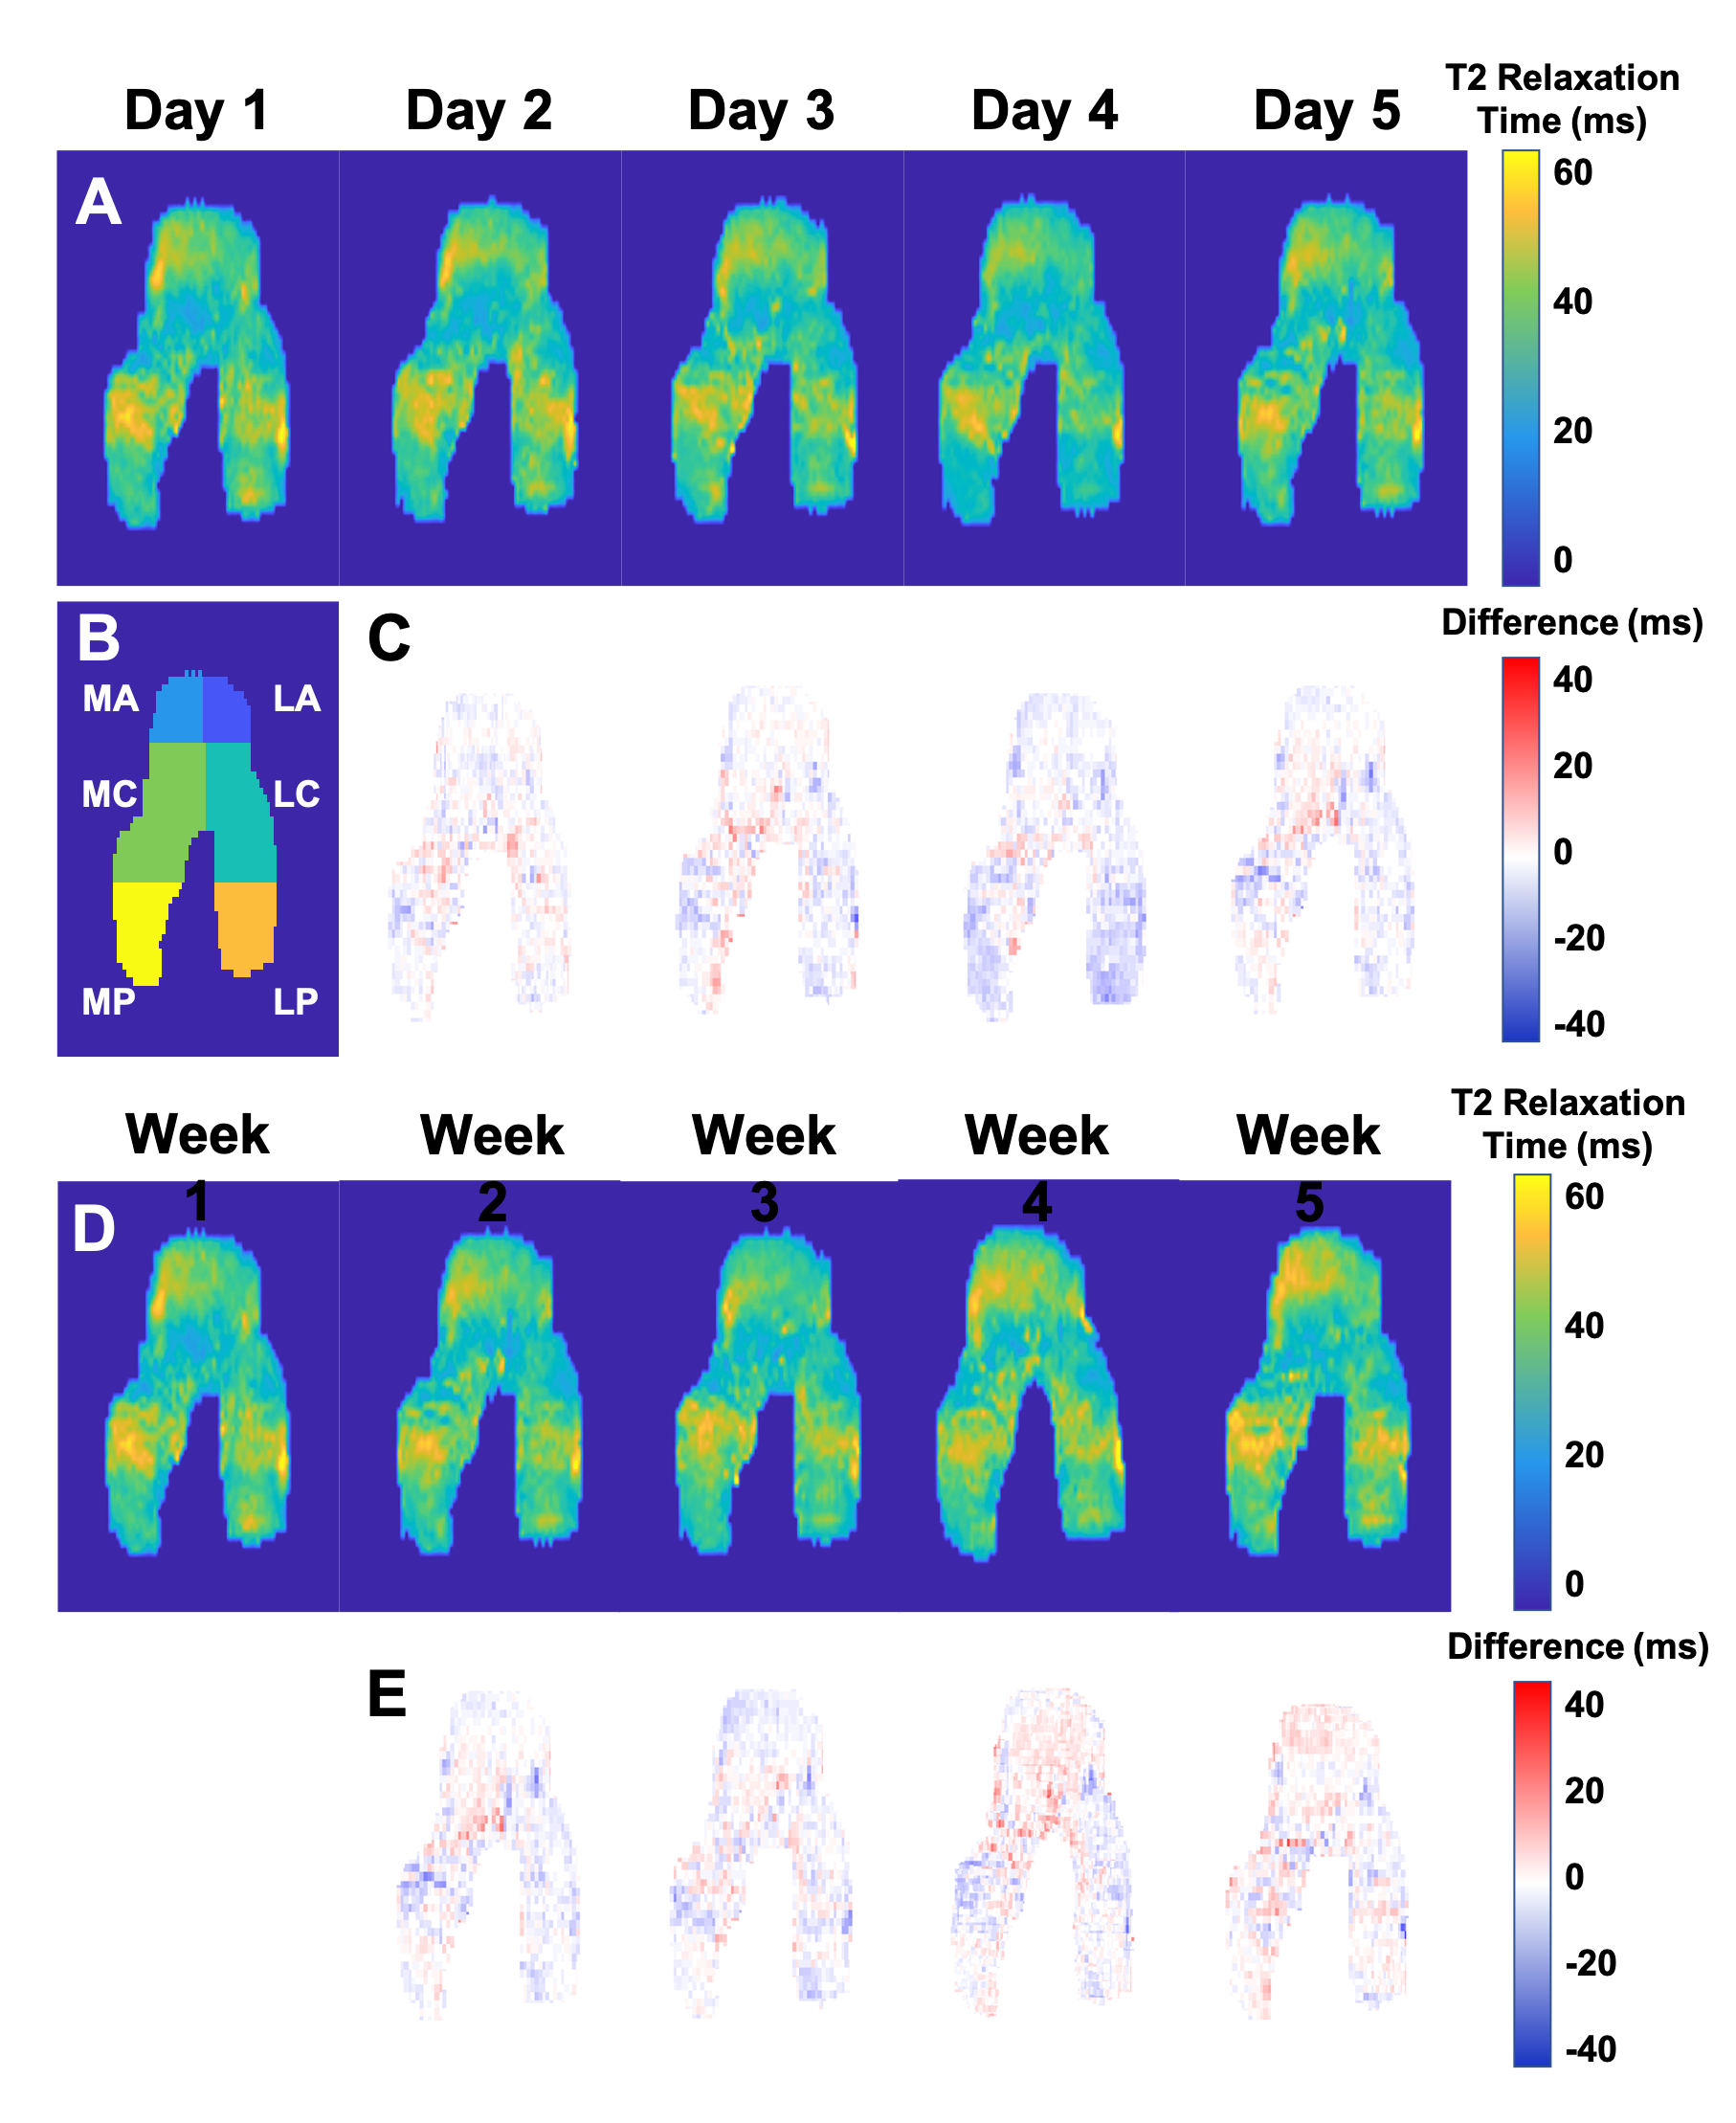
Representative 2D projections of femoral articular cartilage T2 relaxation time maps for the right knee (left not shown) of a subject scanned daily for 5 days [A] and weekly for 5 weeks [D]. Differences in T2 values at each timepoint were calculated with reference to the day 1 scan [C, E]. Variability between timepoints was calculated across the femoral surface, as well as within the anterior (A), central (C), and posterior (P) regions of the medial (M) and lateral (L) portions of the femur [B].
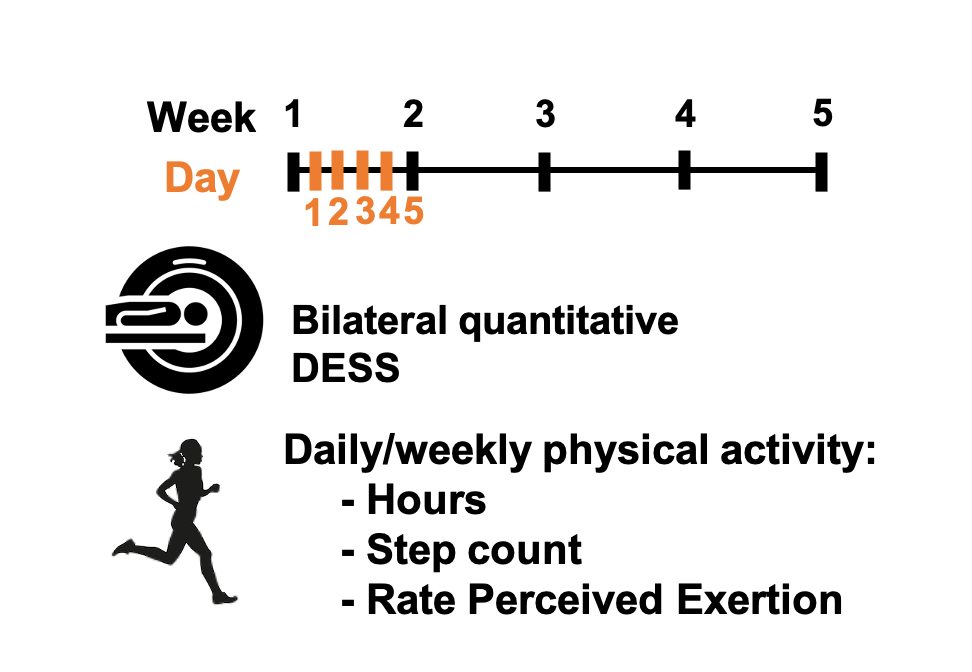
Both knees of 3 healthy female subjects were scanned using a bilateral quantitative double-echo in steady-state (qDESS) sequence on a 3T MRI system. Subjects were scanned daily for 5 consecutive days and weekly for 5 consecutive weeks. At each timepoint, the subjects recorded their hours of physical activity, step count, and Rate Perceived Exertion (RPE) for the 24 hours and week prior to the scan date.