Stefan Zbyn1,2, Cassiano Santiago1, Casey P. Johnson1,3, Kai D. Ludwig1,2, Lin Zhang4, Shelly Marette2, Marc A. Tompkins5, Bradley J. Nelson5, Takashi Takahashi2, Gregory J. Metzger1, Cathy S. Carlson3, and Jutta M. Ellermann1,2
1Center for Magnetic Resonance Research, University of Minnesota, Minneapolis, MN, United States, 2Department of Radiology, University of Minnesota, Minneapolis, MN, United States, 3Department of Veterinary Clinical Sciences, University of Minnesota, St. Paul, MN, United States, 4Division of Biostatistics, School of Public Health, University of Minnesota, Minneapolis, MN, United States, 5Department of Orthopaedic Surgery, University of Minnesota, Minneapolis, MN, United States
1Center for Magnetic Resonance Research, University of Minnesota, Minneapolis, MN, United States, 2Department of Radiology, University of Minnesota, Minneapolis, MN, United States, 3Department of Veterinary Clinical Sciences, University of Minnesota, St. Paul, MN, United States, 4Division of Biostatistics, School of Public Health, University of Minnesota, Minneapolis, MN, United States, 5Department of Orthopaedic Surgery, University of Minnesota, Minneapolis, MN, United States
T2*
mapping is a reproducible, clinically applicable method that allows assessment
of all lesion tissues, quantitative measurement of lesion ossification, and
evaluation of bone density, which are potential predictive markers of JOCD
lesion healing.
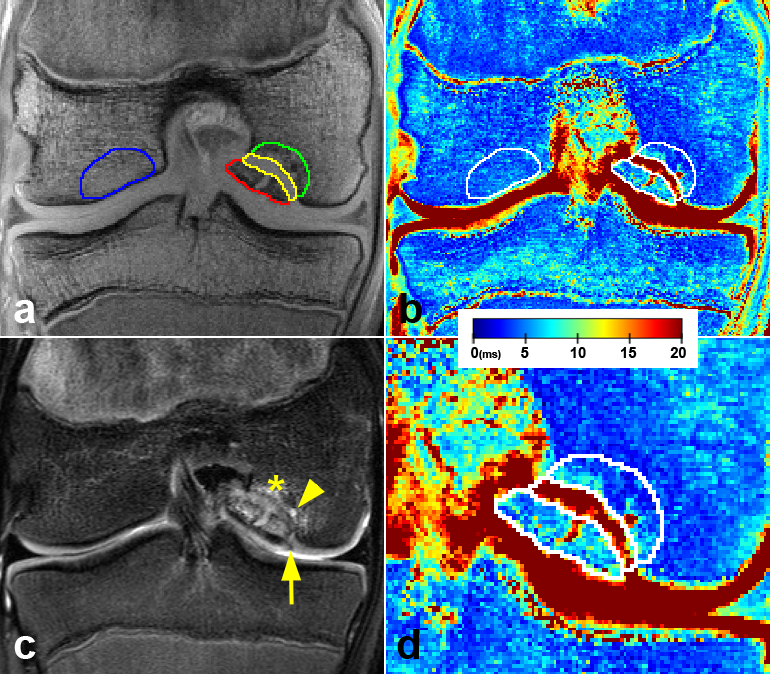
Figure 2. A 16-year-old
boy with the stage III, unstable JOCD lesion. (a) The first echo of the T2*-weighted images with 4 evaluated
regions: progeny (red), interface (yellow), parent bone (green), and control
bone (blue). (b) The corresponding color-coded T2*map. (c) A T2-weighted turbo spin echo image with fat suppression depicting
a break in articular cartilage and subchondral bone plate (arrow), a cyst
(arrowhead), and a hyper-intense edema (asterisks). (d) A zoom of the JOCD lesion area.
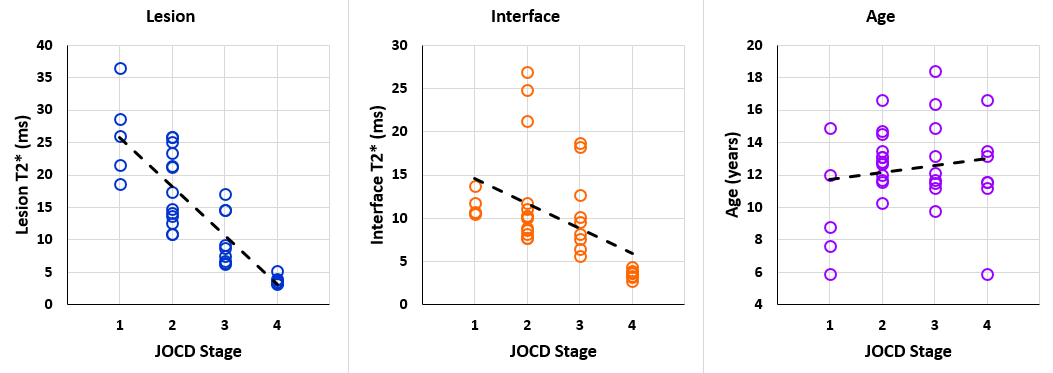
Figure 3. Spearman
rank correlation (ρ) plots. From left a significant negative correlation
between the JOCD stage and the lesion T2* (ρ=-0.871; p<0.001), a significant negative correlation between the JOCD stage
and the interface T2* (ρ=-0.649; p<0.001), and no significant correlation between the JOCD stage and the patient’s
age (ρ=0.081; p=0.65).