Melissa E Baker1, Lucy E Kershaw2, Steve Roberts3, Richard Reardon1, Sionagh Smith1, and Sarah E Taylor1
1Royal (Dick) School of Veterinary Studies and The Roslin Institute, The University of Edinburgh, Edinburgh, United Kingdom, 2Centre for Cardiovascular sciences and Edinburgh Imaging, The University of Edinburgh, Edinburgh, United Kingdom, 3Hallmark Veterinary Imaging Ltd, Guildford, United Kingdom
1Royal (Dick) School of Veterinary Studies and The Roslin Institute, The University of Edinburgh, Edinburgh, United Kingdom, 2Centre for Cardiovascular sciences and Edinburgh Imaging, The University of Edinburgh, Edinburgh, United Kingdom, 3Hallmark Veterinary Imaging Ltd, Guildford, United Kingdom
T2 mapping was shown to detect significantly increased T2 in the DIPJ lateral cartilage (higher OARSI grades) compared to the medial cartilage (lower OARSI grades) using a 0.27 T open MR system
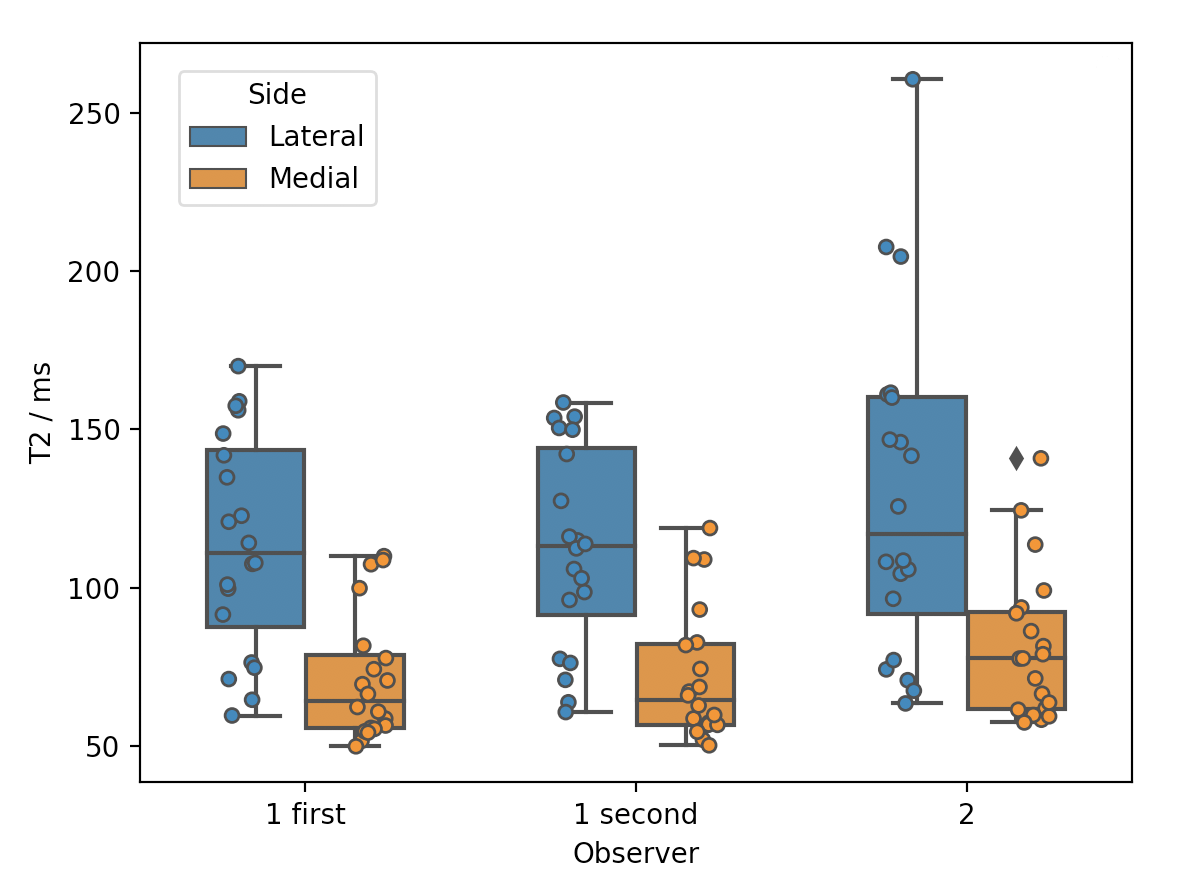
Figure 3. Box plots of observer one’s first and second lateral (blue) and medial (orange) T2 measurements and observer two’s first measurements. Boxes show minimum T2, median with interquartile range and maximum T2, along with individual data points.
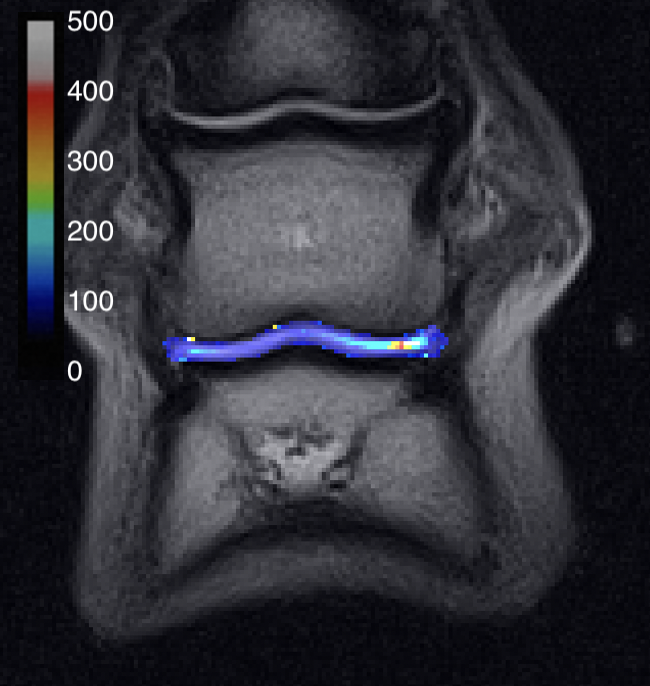
Figure 4. Example T2 map depicting increased T2 in the lateral condylar articular cartilage of P2 and articulating P3. Colour bar in ms.