Yongcheng YAO1, Sheheryar KHAN1, Junru ZHONG1, Siyue LI1, and Weitian CHEN1
1Department of Imaging and Interventional Radiology, The Chinese University of Hong Kong, Hong Kong, China
1Department of Imaging and Interventional Radiology, The Chinese University of Hong Kong, Hong Kong, China
An automated data processing pipeline is proposed to generate knee cartilage thickness map from MR image. The proposed method benefits from accurate estimation of surface normal. It is advantageous compared with 3D nearest neighbor approach.
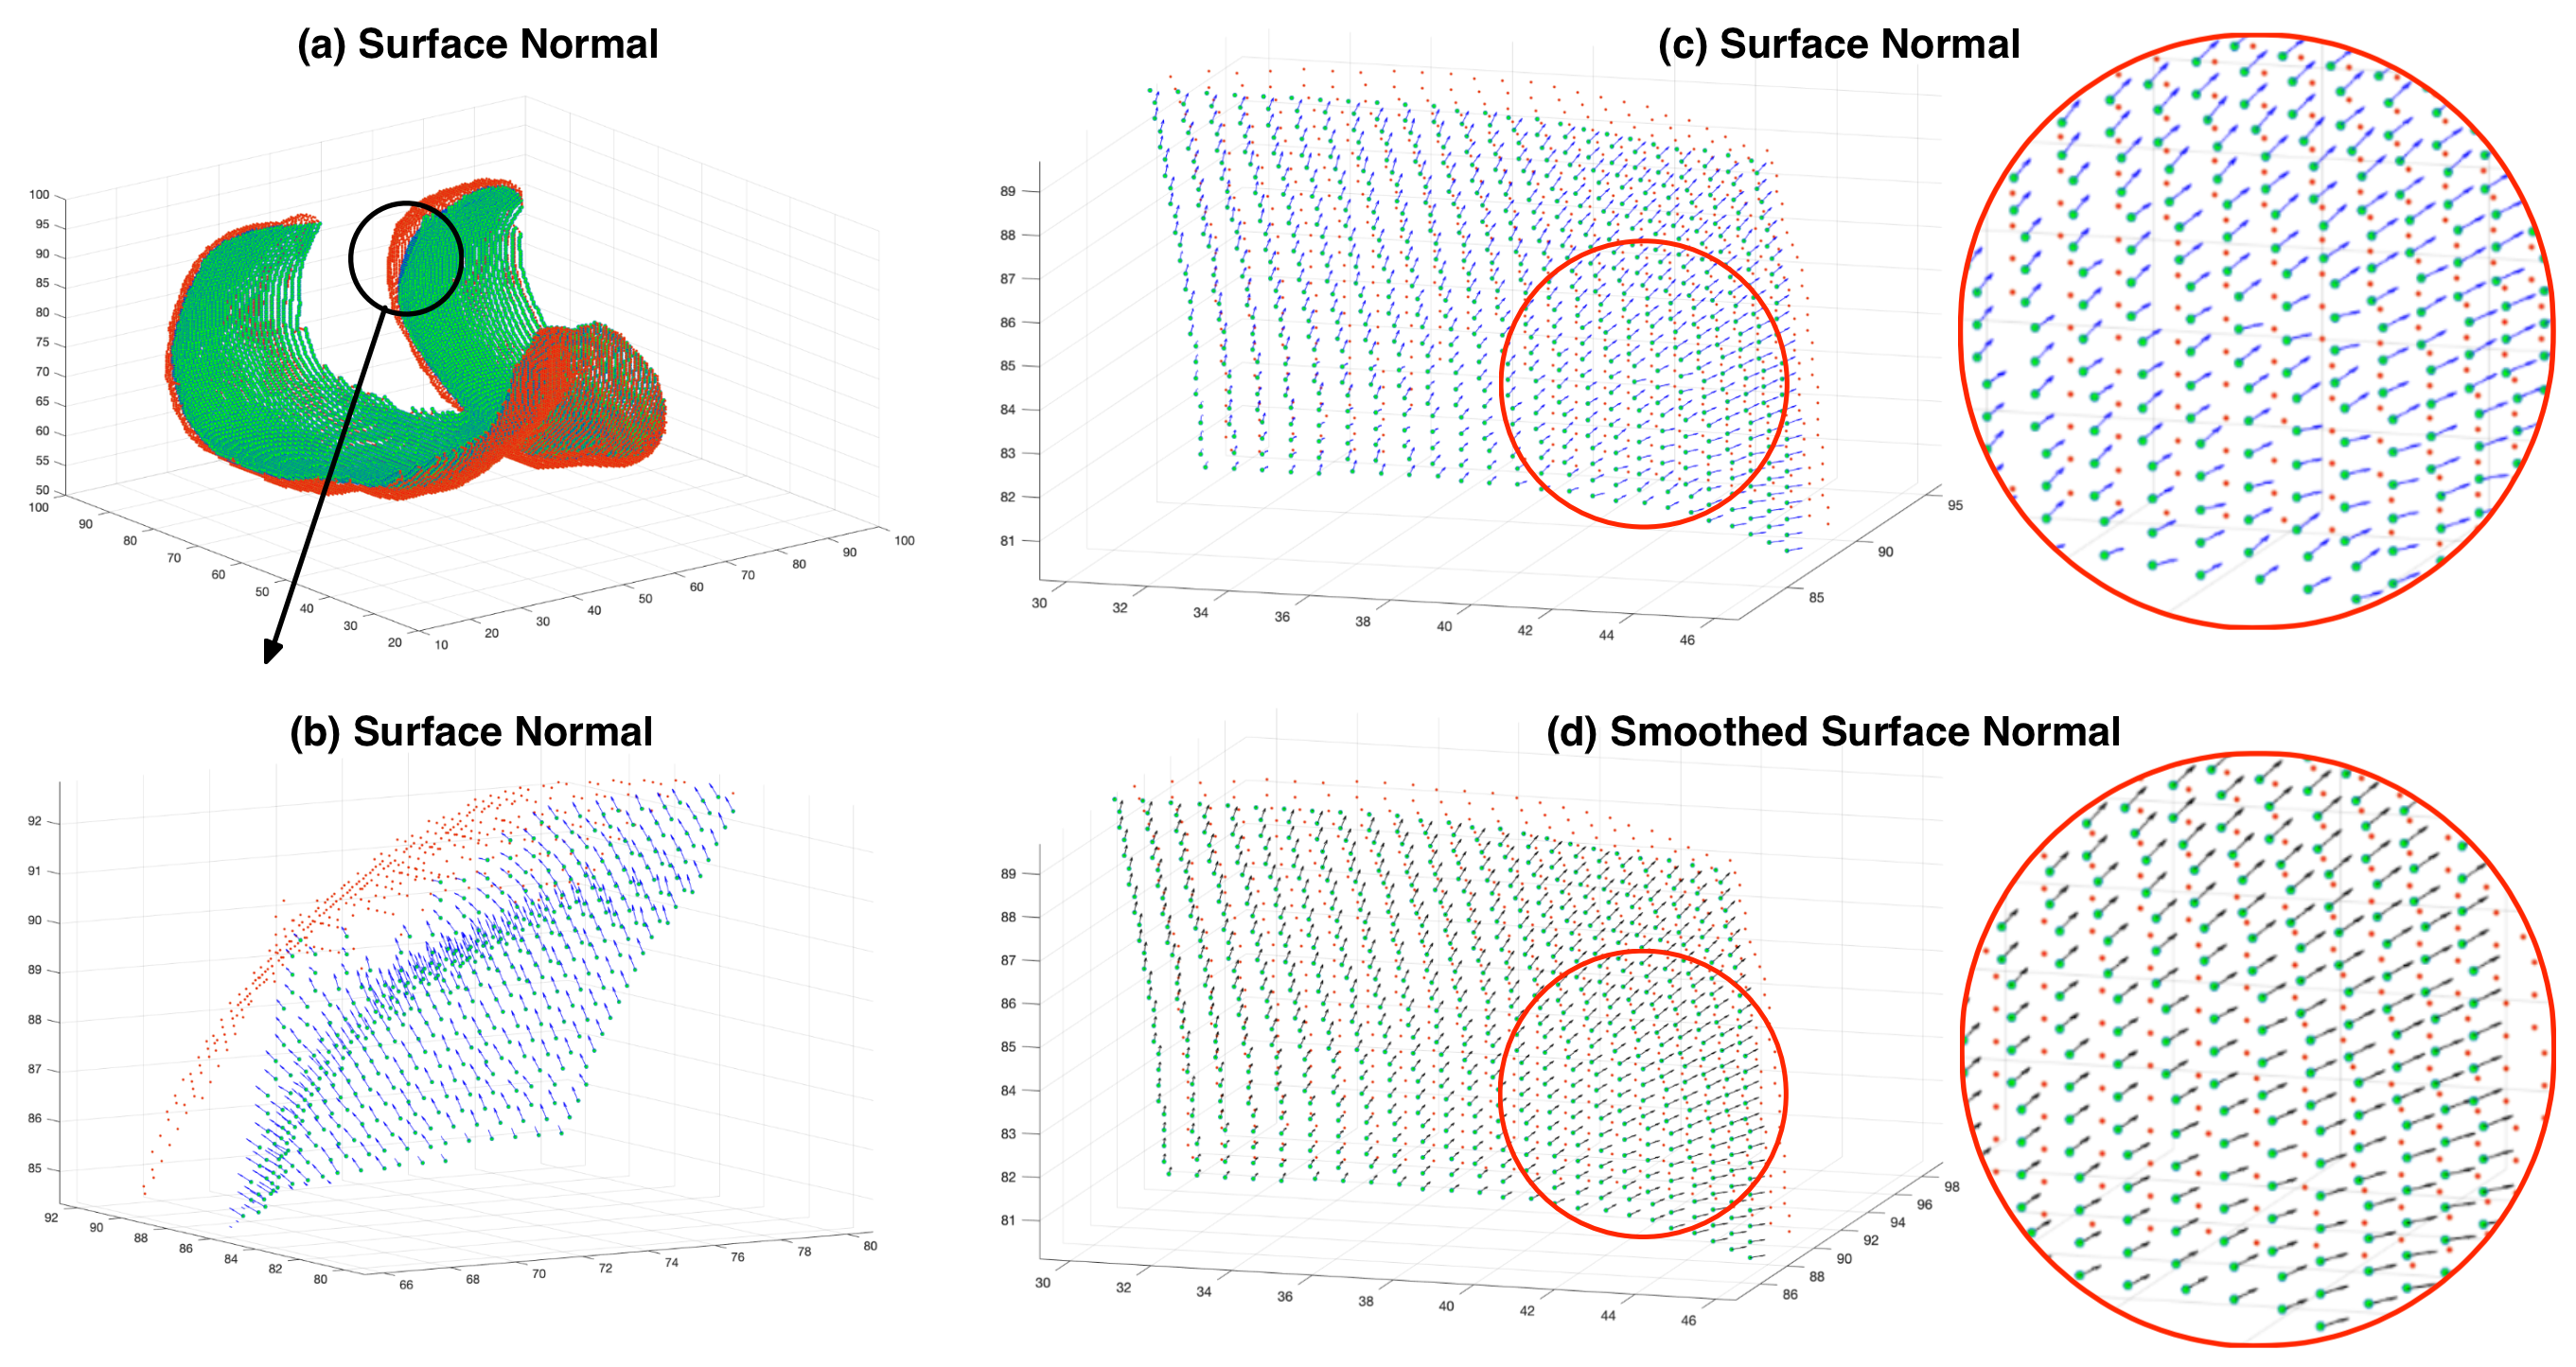
Figure 3. Surface normal estimation. (a-c) the estimated surface normal. (d) the smoothed surface normal after 8-neighbors average-smoothing. (Green dot: voxel from the bone-cartilage interface; Red dot: voxel from outer boundary; Blue arrow: estimated surface normal; Black arrow: smoothed surface normal) (Image ID in the OAI-ZIB dataset: 9389580)
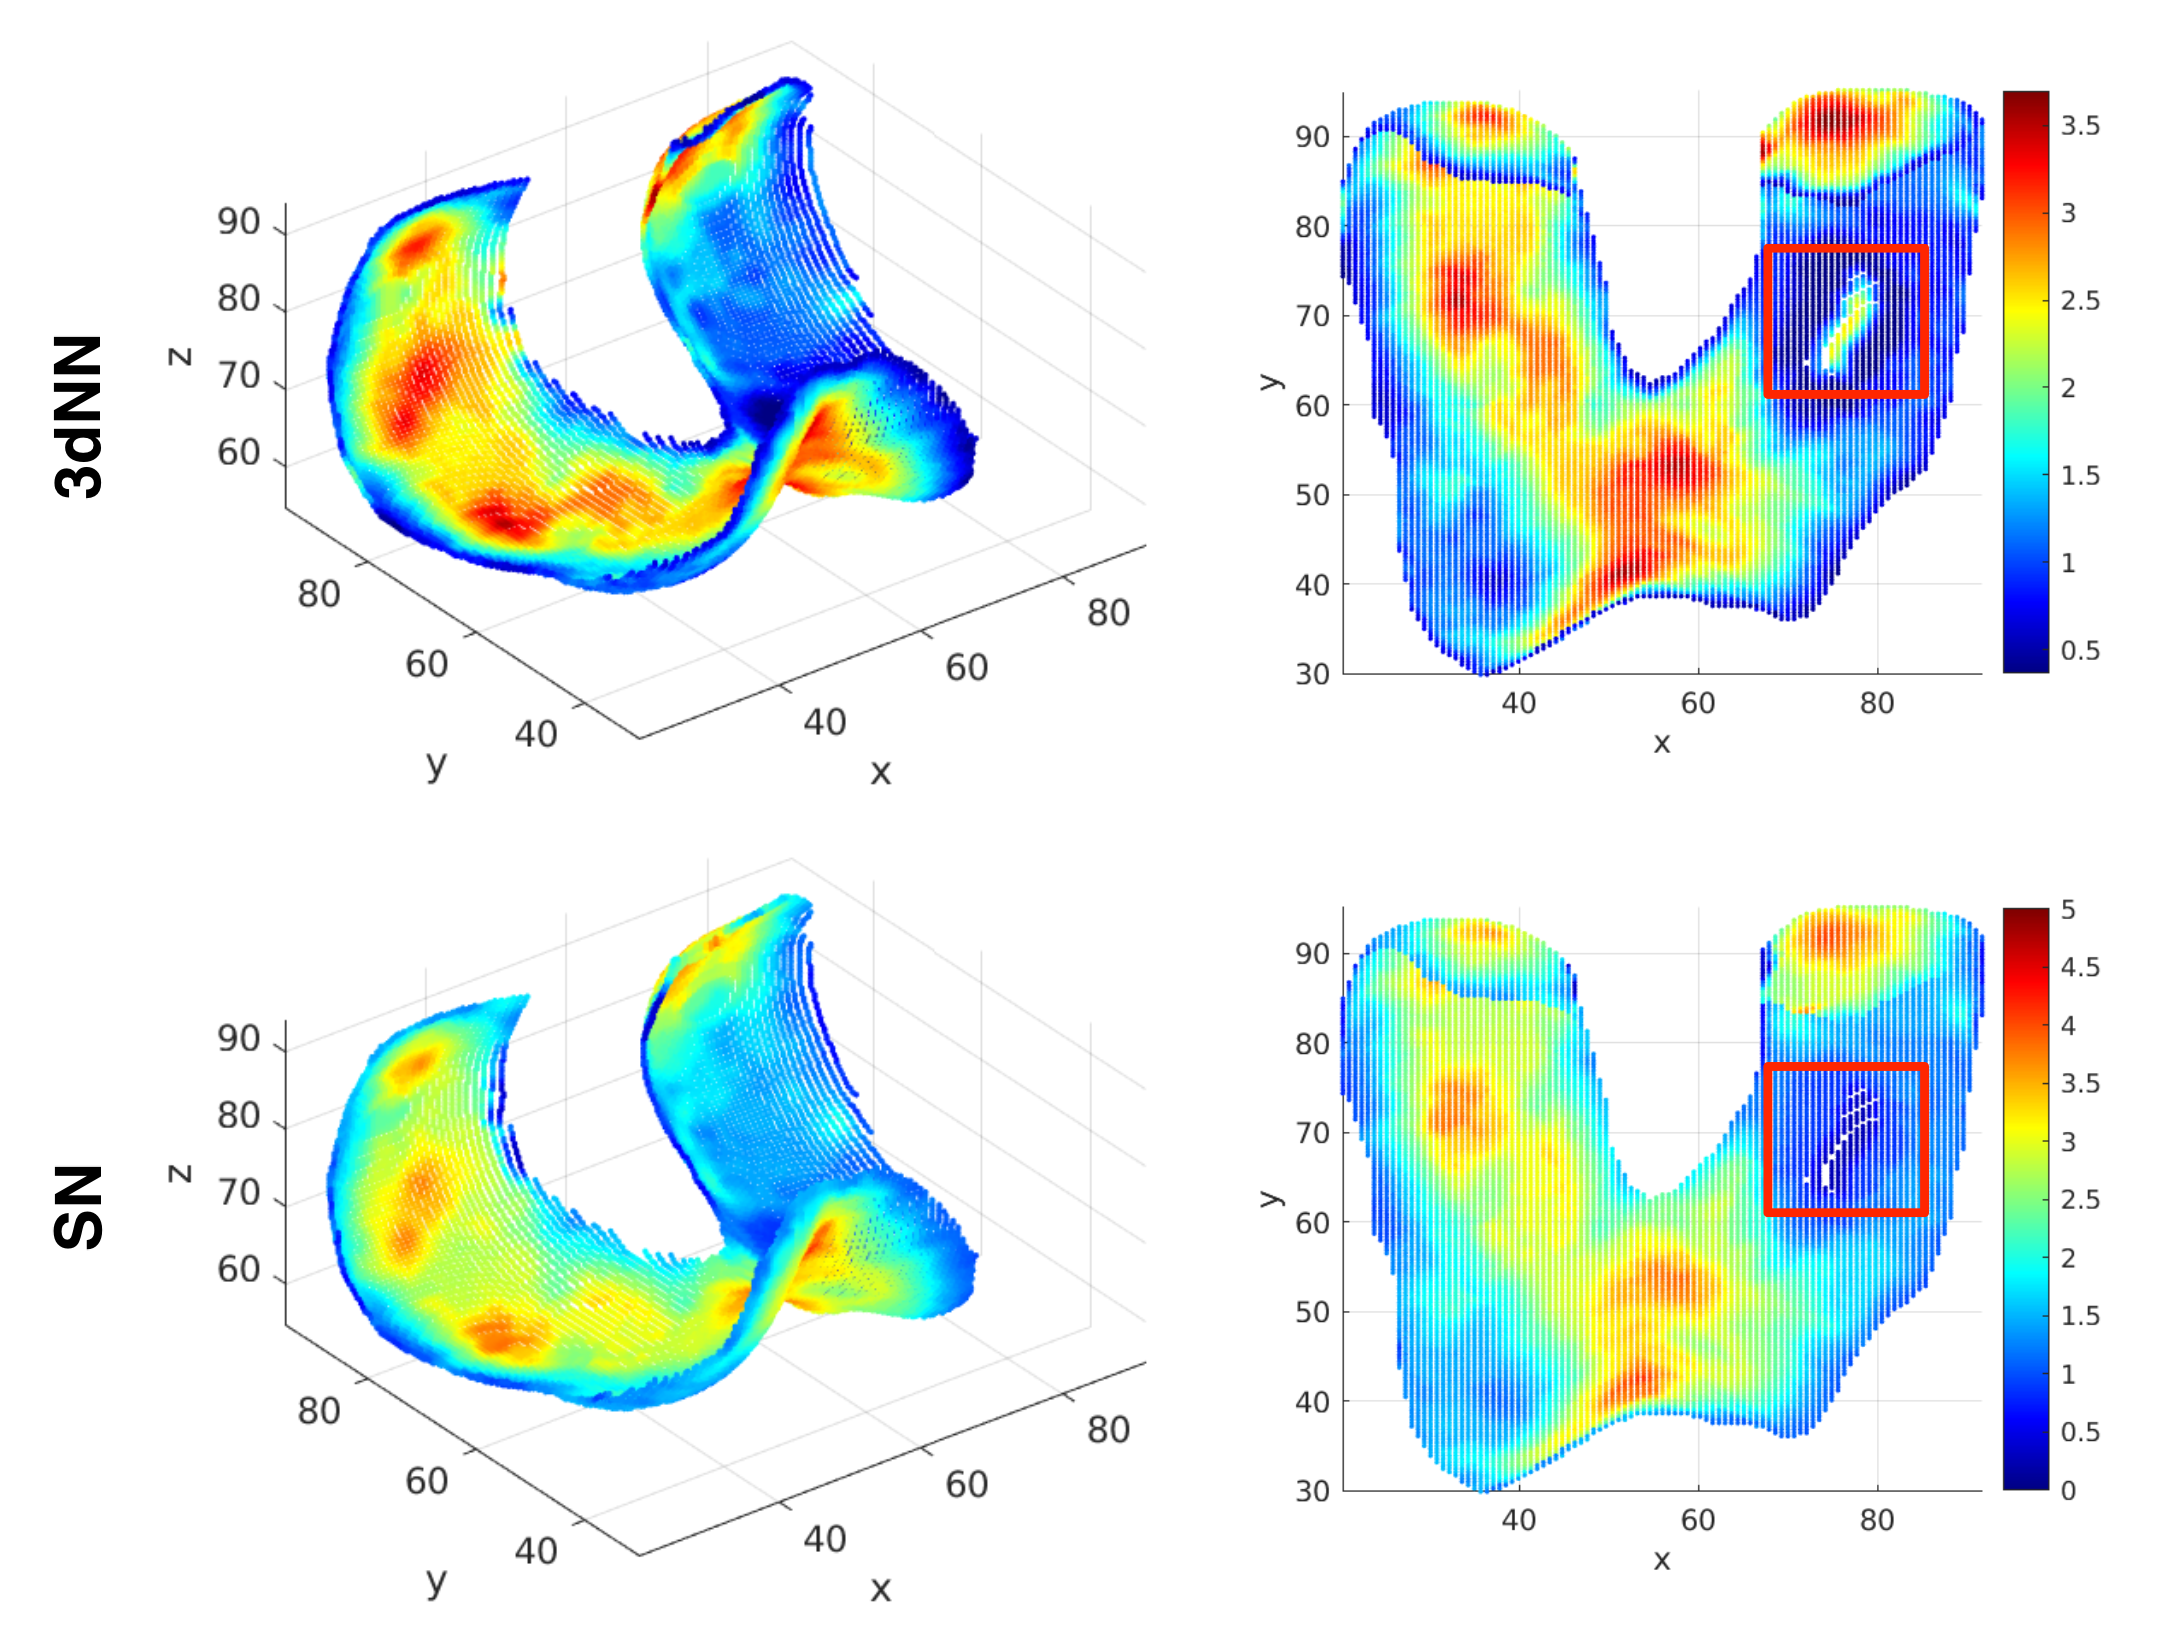
Figure 4. Comparison of 3dNN and SN method in cartilage thickness measurement. From the proposed SN method, both minimal and maximal thickness maps can be generated. The one shown here is the minimal thickness map. (3dNN: 3d nearest neighbor; SN: surface normal) (Image ID in the OAI-ZIB dataset: 9389580)