Blake Alexander Benyard1, Ryan Armbruster1, Abigail Cember1, Neil Wilson2, Ravinder Reddy1, and Joshua Baker3
1Radiology, University of Pennsylvania, Philadelphia, PA, United States, 2Siemens Medical Solutions USA Inc, Malvern, PA, United States, 3Penn Medicine, Rheumatology, Philadelphia Veterans’ Affairs Medical Center, Philadelphia, PA, United States
1Radiology, University of Pennsylvania, Philadelphia, PA, United States, 2Siemens Medical Solutions USA Inc, Malvern, PA, United States, 3Penn Medicine, Rheumatology, Philadelphia Veterans’ Affairs Medical Center, Philadelphia, PA, United States
GagCEST MRI revealed an increase in GagCEST (%) values for control patients in comparison to OA patients and can serve as a sensitive molecular biomarker for quantifying early metabolic changes in cartilage.
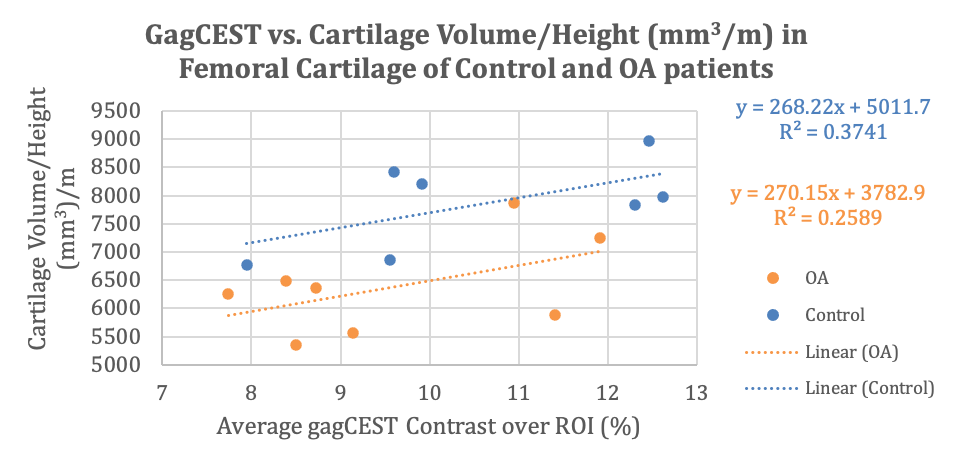
Figure 3: GagCEST vs. Cartilage Volume/Height (mm3/m) in Femoral Cartilage of Control and OA patients. The y-axis of Volume/Height (mm3/m) shows the relationship of larger height and greater cartilage volume. This shows a positive linear relationship in both control and OA patients. On average, OA subjects have a lesser Volume/Height as well as a lesser slope.
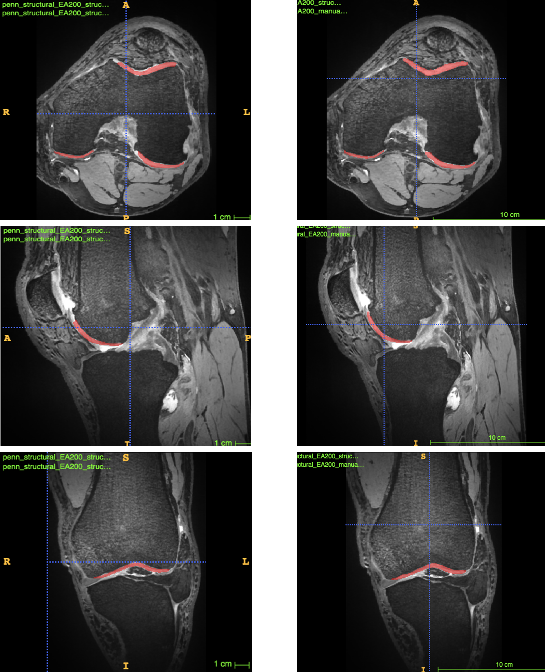
Image 1: Manually Segmented Articular Knee Cartilage – on the left is a pyKNEEr generated segmentation and on the right is a manually corrected segmentation.