Olli Nykänen1, Nina E Hänninen1,2, Swetha Pala1, Ali Mohammadi1, Mohammadhossein Ebrahimi1,2, Nikae CR te Moller3, Harold Brommer3, Rene van Weeren3, Janne TA Mäkelä1, Rami K Korhonen1, Juha Töyräs1,4,5, and Mikko J Nissi1,2
1Department of Applied Physics, University of Eastern Finland, Kuopio, Finland, 2Research Unit of Medical Imaging, Physics and Technology, University of Oulu, Oulu, Finland, 3Department of Clinical Sciences, Faculty of Veterinary Medicine, Utrecht University, Utrecht, Netherlands, 4Diagnostic Imaging Center, Kuopio University Hospital, Kuopio, Finland, 5School of Information Technology and Electrical Engineering, The University of Queensland, Brisbane, Australia
1Department of Applied Physics, University of Eastern Finland, Kuopio, Finland, 2Research Unit of Medical Imaging, Physics and Technology, University of Oulu, Oulu, Finland, 3Department of Clinical Sciences, Faculty of Veterinary Medicine, Utrecht University, Utrecht, Netherlands, 4Diagnostic Imaging Center, Kuopio University Hospital, Kuopio, Finland, 5School of Information Technology and Electrical Engineering, The University of Queensland, Brisbane, Australia
Adiabatic
T1rho relaxation is significantly elevated in bluntly damaged cartilage tissue
in ROIs spanning the full thickness of cartilage. Furthermore, moderate
correlation between qMRI parameters and equilibrium modulus of articular
cartilage was found applying multiple regression.
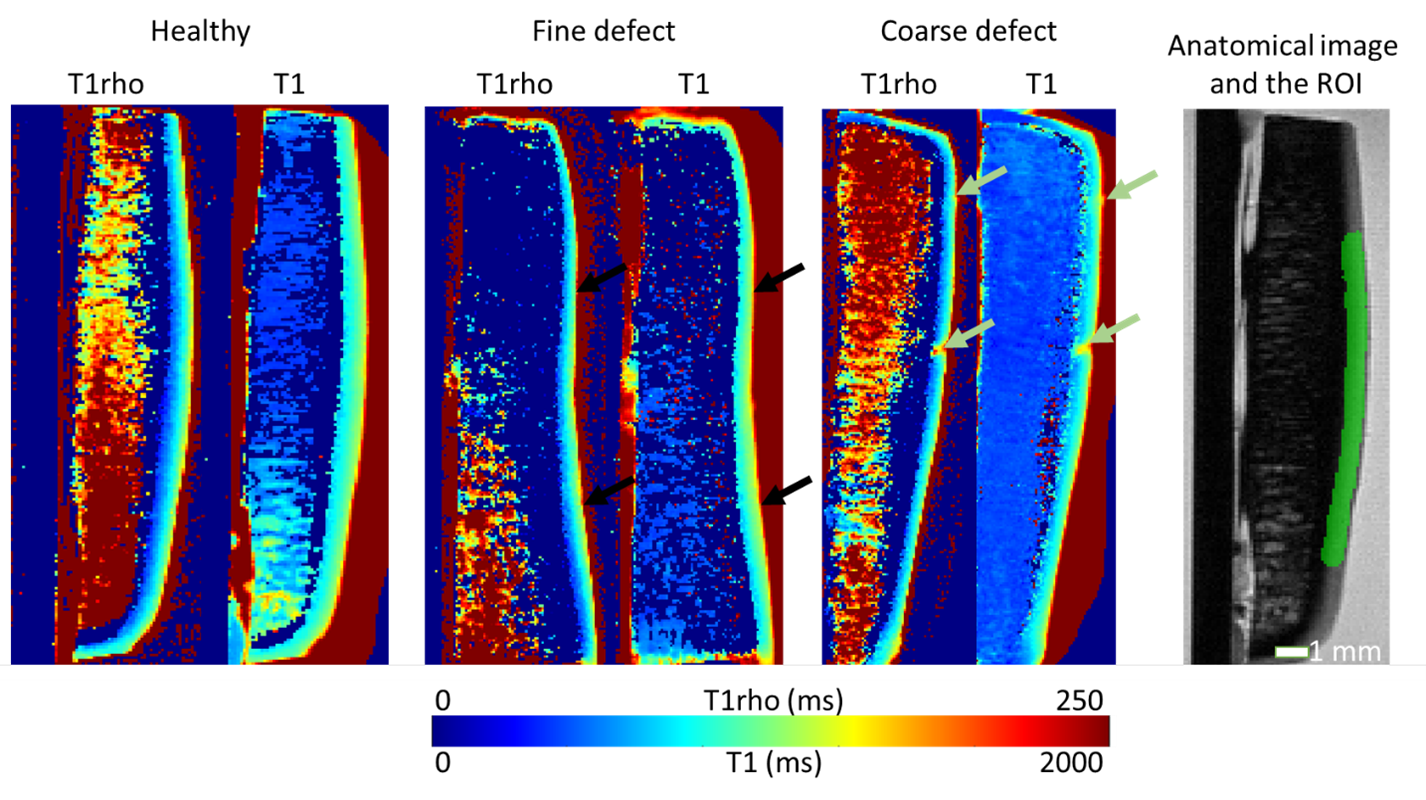
Figure 1:
Example T1rho and T1 maps from healthy (contralateral) and grooved
osteochondral samples. The blunt grooves can be seen in both maps as increases
in the relaxation time values (indicated with the green arrows). The sharp grooves
(black arrows) are not seen in the qMRI maps. On the right, anatomical image with
large ROI indicated.
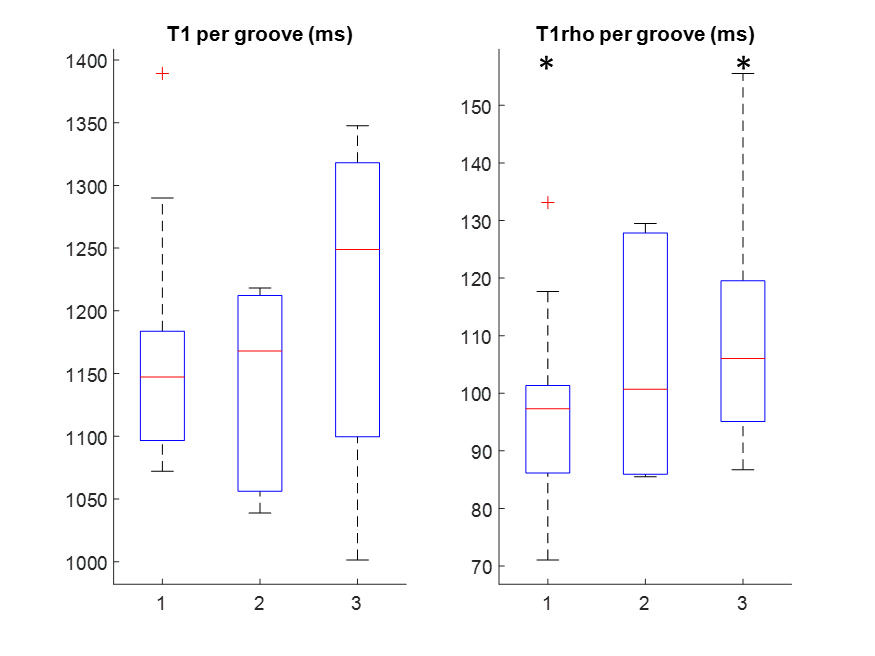
Figure 2:
Relaxation time distributions for the different groups. 1: Contralateral controls,
2: sharp groove, and 3: blunt groove. Red plusses indicate outliers. Even
though the values of different groups overlap, the difference between the T1rho
of contralateral controls and bluntly grooved groups was statistically
significant by ANCOVA (p<0.05). Black asterisk indicates statistically
significant differences.