Garret M. Powell1, Robert J. Spinner2,3, Benjamin M. Howe1, Matthew A. Frick1, Andrew J. Fagan1, Venkata V. Chebrolu4, Peter D. Kollasch4, Eric G. Stinson4, Joel P. Felmlee1, and Kimberly K. Amrami1,2
1Radiology, Mayo Clinic, Rochester, MN, United States, 2Neurologic Surgery, Mayo Clinic, Rochester, MN, United States, 3Orthopedic Surgery, Mayo Clinic, Rochester, MN, United States, 4Siemens Medical Solutions USA, Inc., Rochester, MN, United States
1Radiology, Mayo Clinic, Rochester, MN, United States, 2Neurologic Surgery, Mayo Clinic, Rochester, MN, United States, 3Orthopedic Surgery, Mayo Clinic, Rochester, MN, United States, 4Siemens Medical Solutions USA, Inc., Rochester, MN, United States
Illustrated clinical examples of MSK imaging at
7T demonstrate the clinical utility, diagnostic advantages, and challenges of
performing these examinations compared to lower field strengths
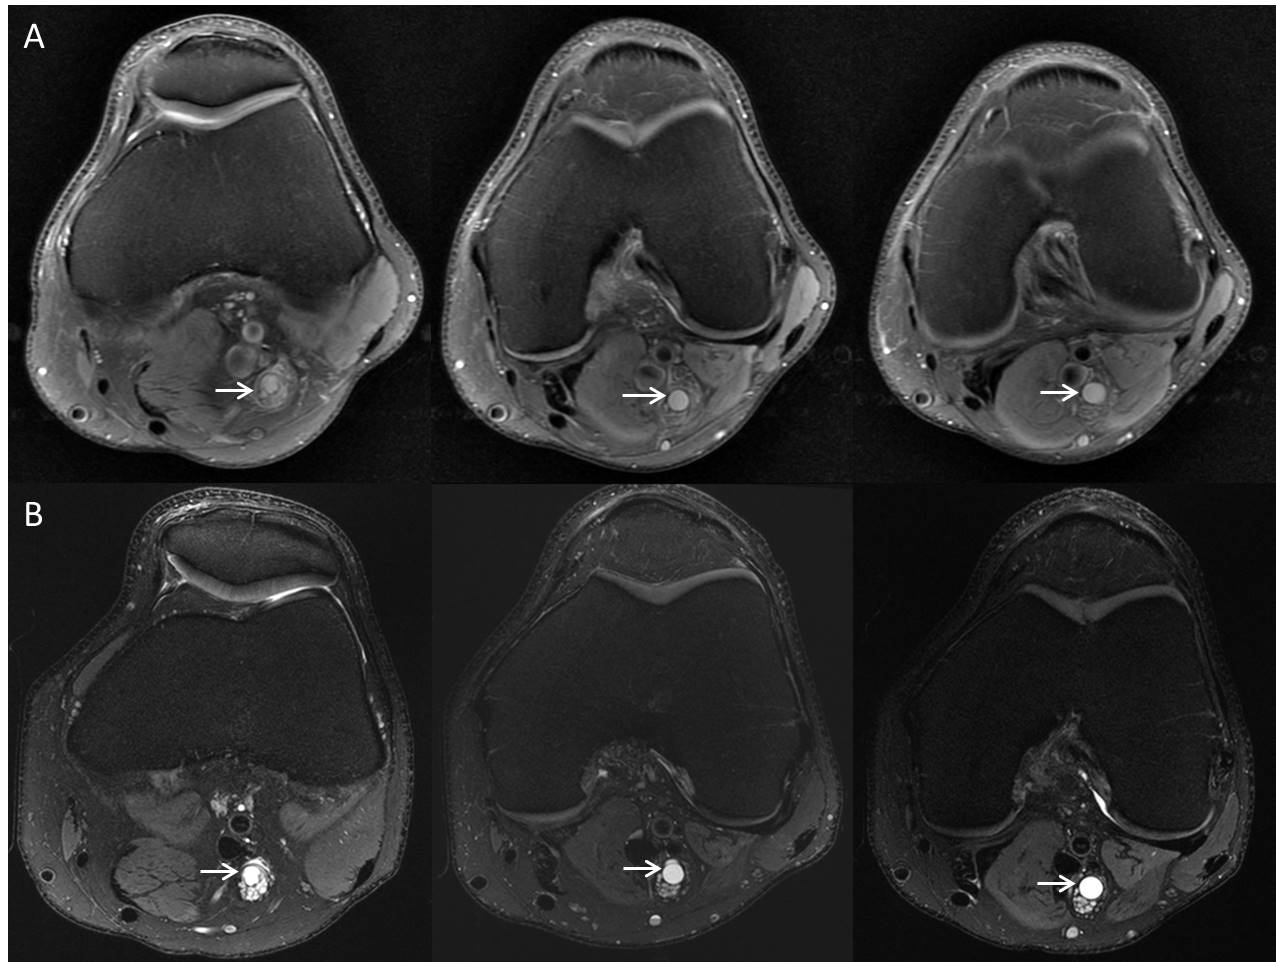
Figure
1: Axial proton density fat suppressed images performed at 3T (row A) and T2
weighted fat suppressed images performed at 7T (row B) demonstrating an
intraneural ganglion cyst coursing along the anterior aspect of the tibial nerve
(arrows). Notice the clearly distinct fascicles of the tibial nerve, as well as
the increased signal to noise ratio, resolution, and tissue contrast seen at
7T.
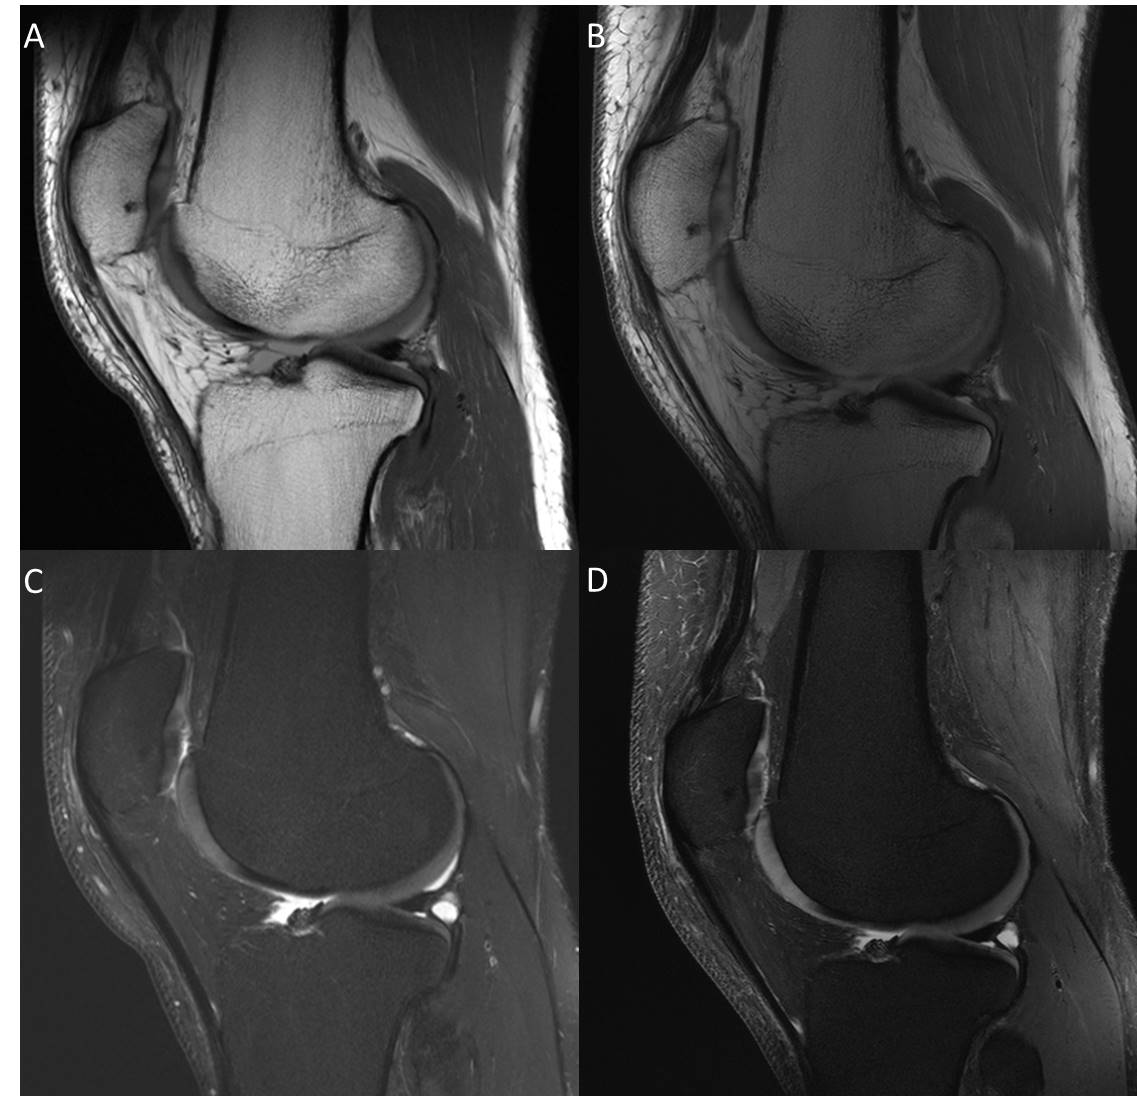
Figure
3: Sagittal proton density and T2 weighted fat suppressed images performed at
3T (A and C, respectively) and 7T (B and D, respectively). Tissue contrast is suboptimal
in the non-fat suppressed proton density image performed at 7T (B) compared to
3T (A). There is also an identifiable superior to inferior and anterior to
posterior signal gradient related to the coil which is worse at 7T (B). Reasonable
T2 weighted fat suppression is achieved at 7T (D); however, there is poor image
uniformity seen superior to inferior and anterior to posterior compared to 3T
(C).