Kaixuan Zhao1,2, Joao dos Santos Periquito3, Thomas Gladytz2, Kathleen Cantow3, Luis Hummel3, Jason Millward2, Sonia Waiczies2, Erdmann Seeliger3, Yanqiu Feng1, and Thoralf Niendorf2,4
1School of Biomedical Engineering, Southern Medical University, Guangzhou, China, 2Berlin Ultrahigh Field Facility (B.U.F.F.), Max Delbruck Center for Molecular Medicine in the Helmholtz Association, Berlin, Germany, 3Institute of Physiology, Charité - Universitätsmedizin Berlin, Berlin, Germany, 4Experimental and Clinical Research Center, a joint cooperation between the Charité Medical Faculty and the Max Delbrück Center for Molecular Medicine in the Helmholtz Association, Berlin, Germany
1School of Biomedical Engineering, Southern Medical University, Guangzhou, China, 2Berlin Ultrahigh Field Facility (B.U.F.F.), Max Delbruck Center for Molecular Medicine in the Helmholtz Association, Berlin, Germany, 3Institute of Physiology, Charité - Universitätsmedizin Berlin, Berlin, Germany, 4Experimental and Clinical Research Center, a joint cooperation between the Charité Medical Faculty and the Max Delbrück Center for Molecular Medicine in the Helmholtz Association, Berlin, Germany
With
the progression of hypoxia, renal size decreased by ~10%. During the reoxygenation phase renal size rapidly
recovered to baseline. A comparison between renal size and renal T2* demonstrates that rapid
renal size recovery is paralleled by T2* recovery.
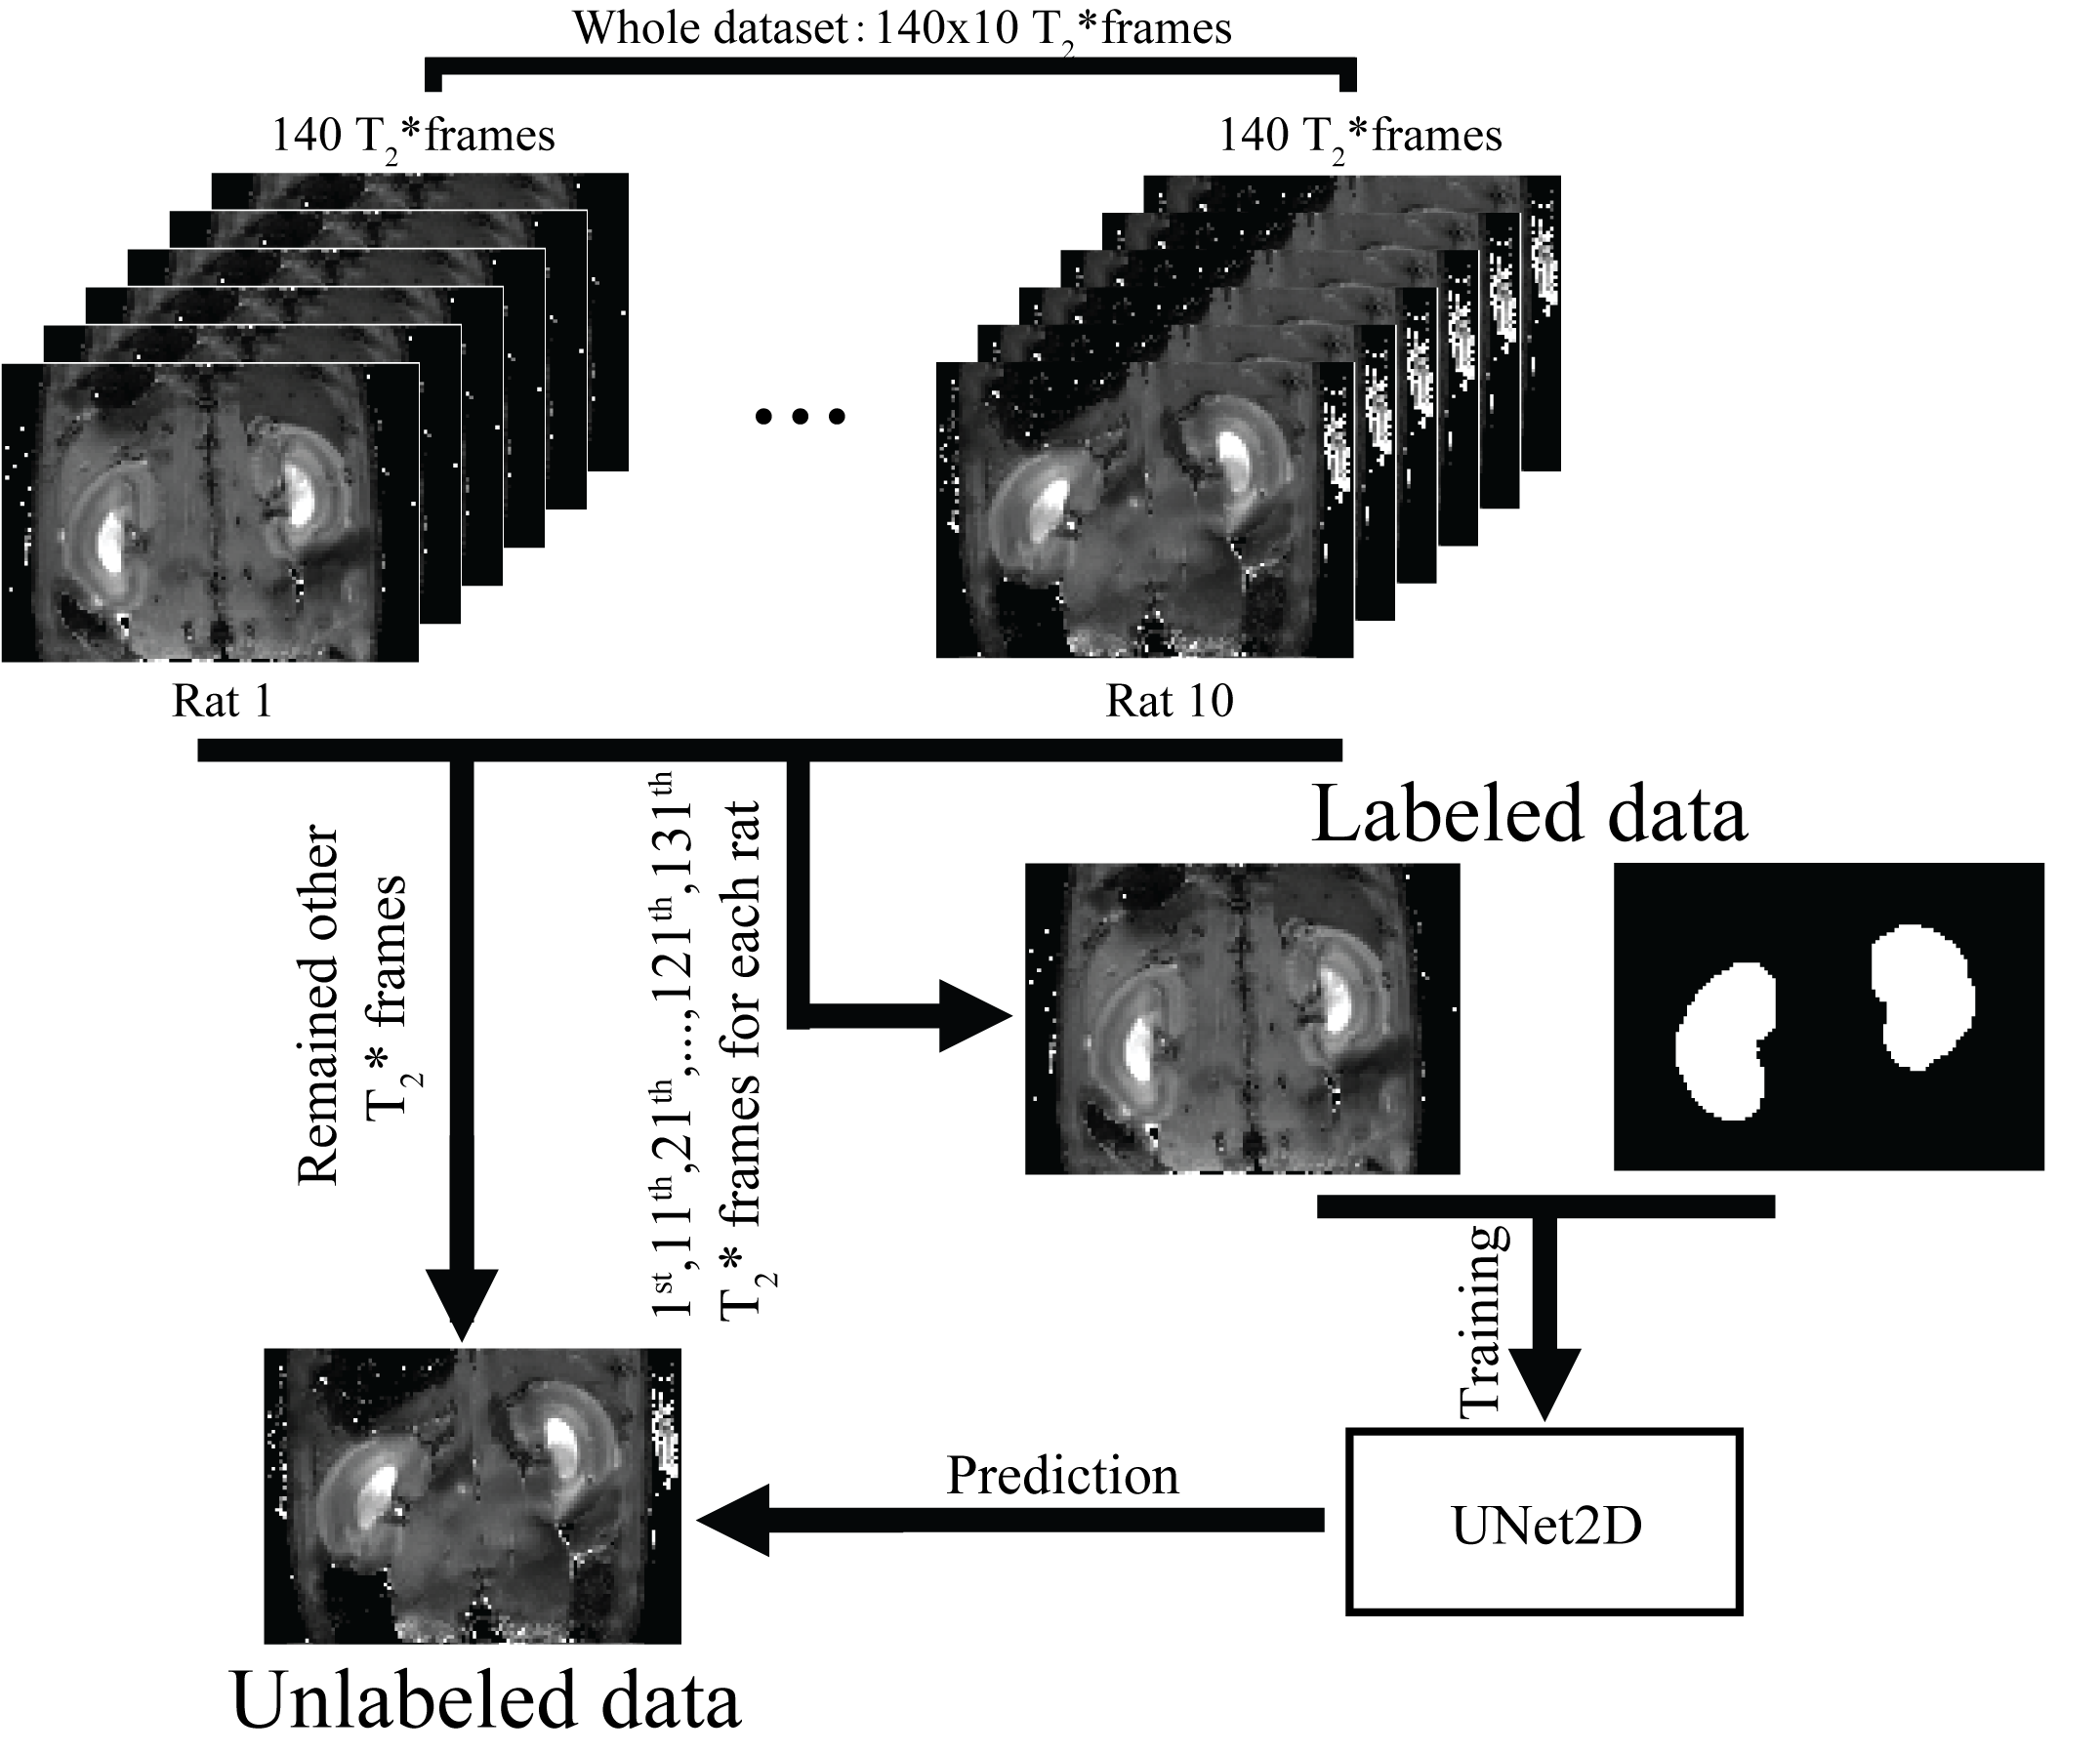
Figure 1. Flow chart of experiment design
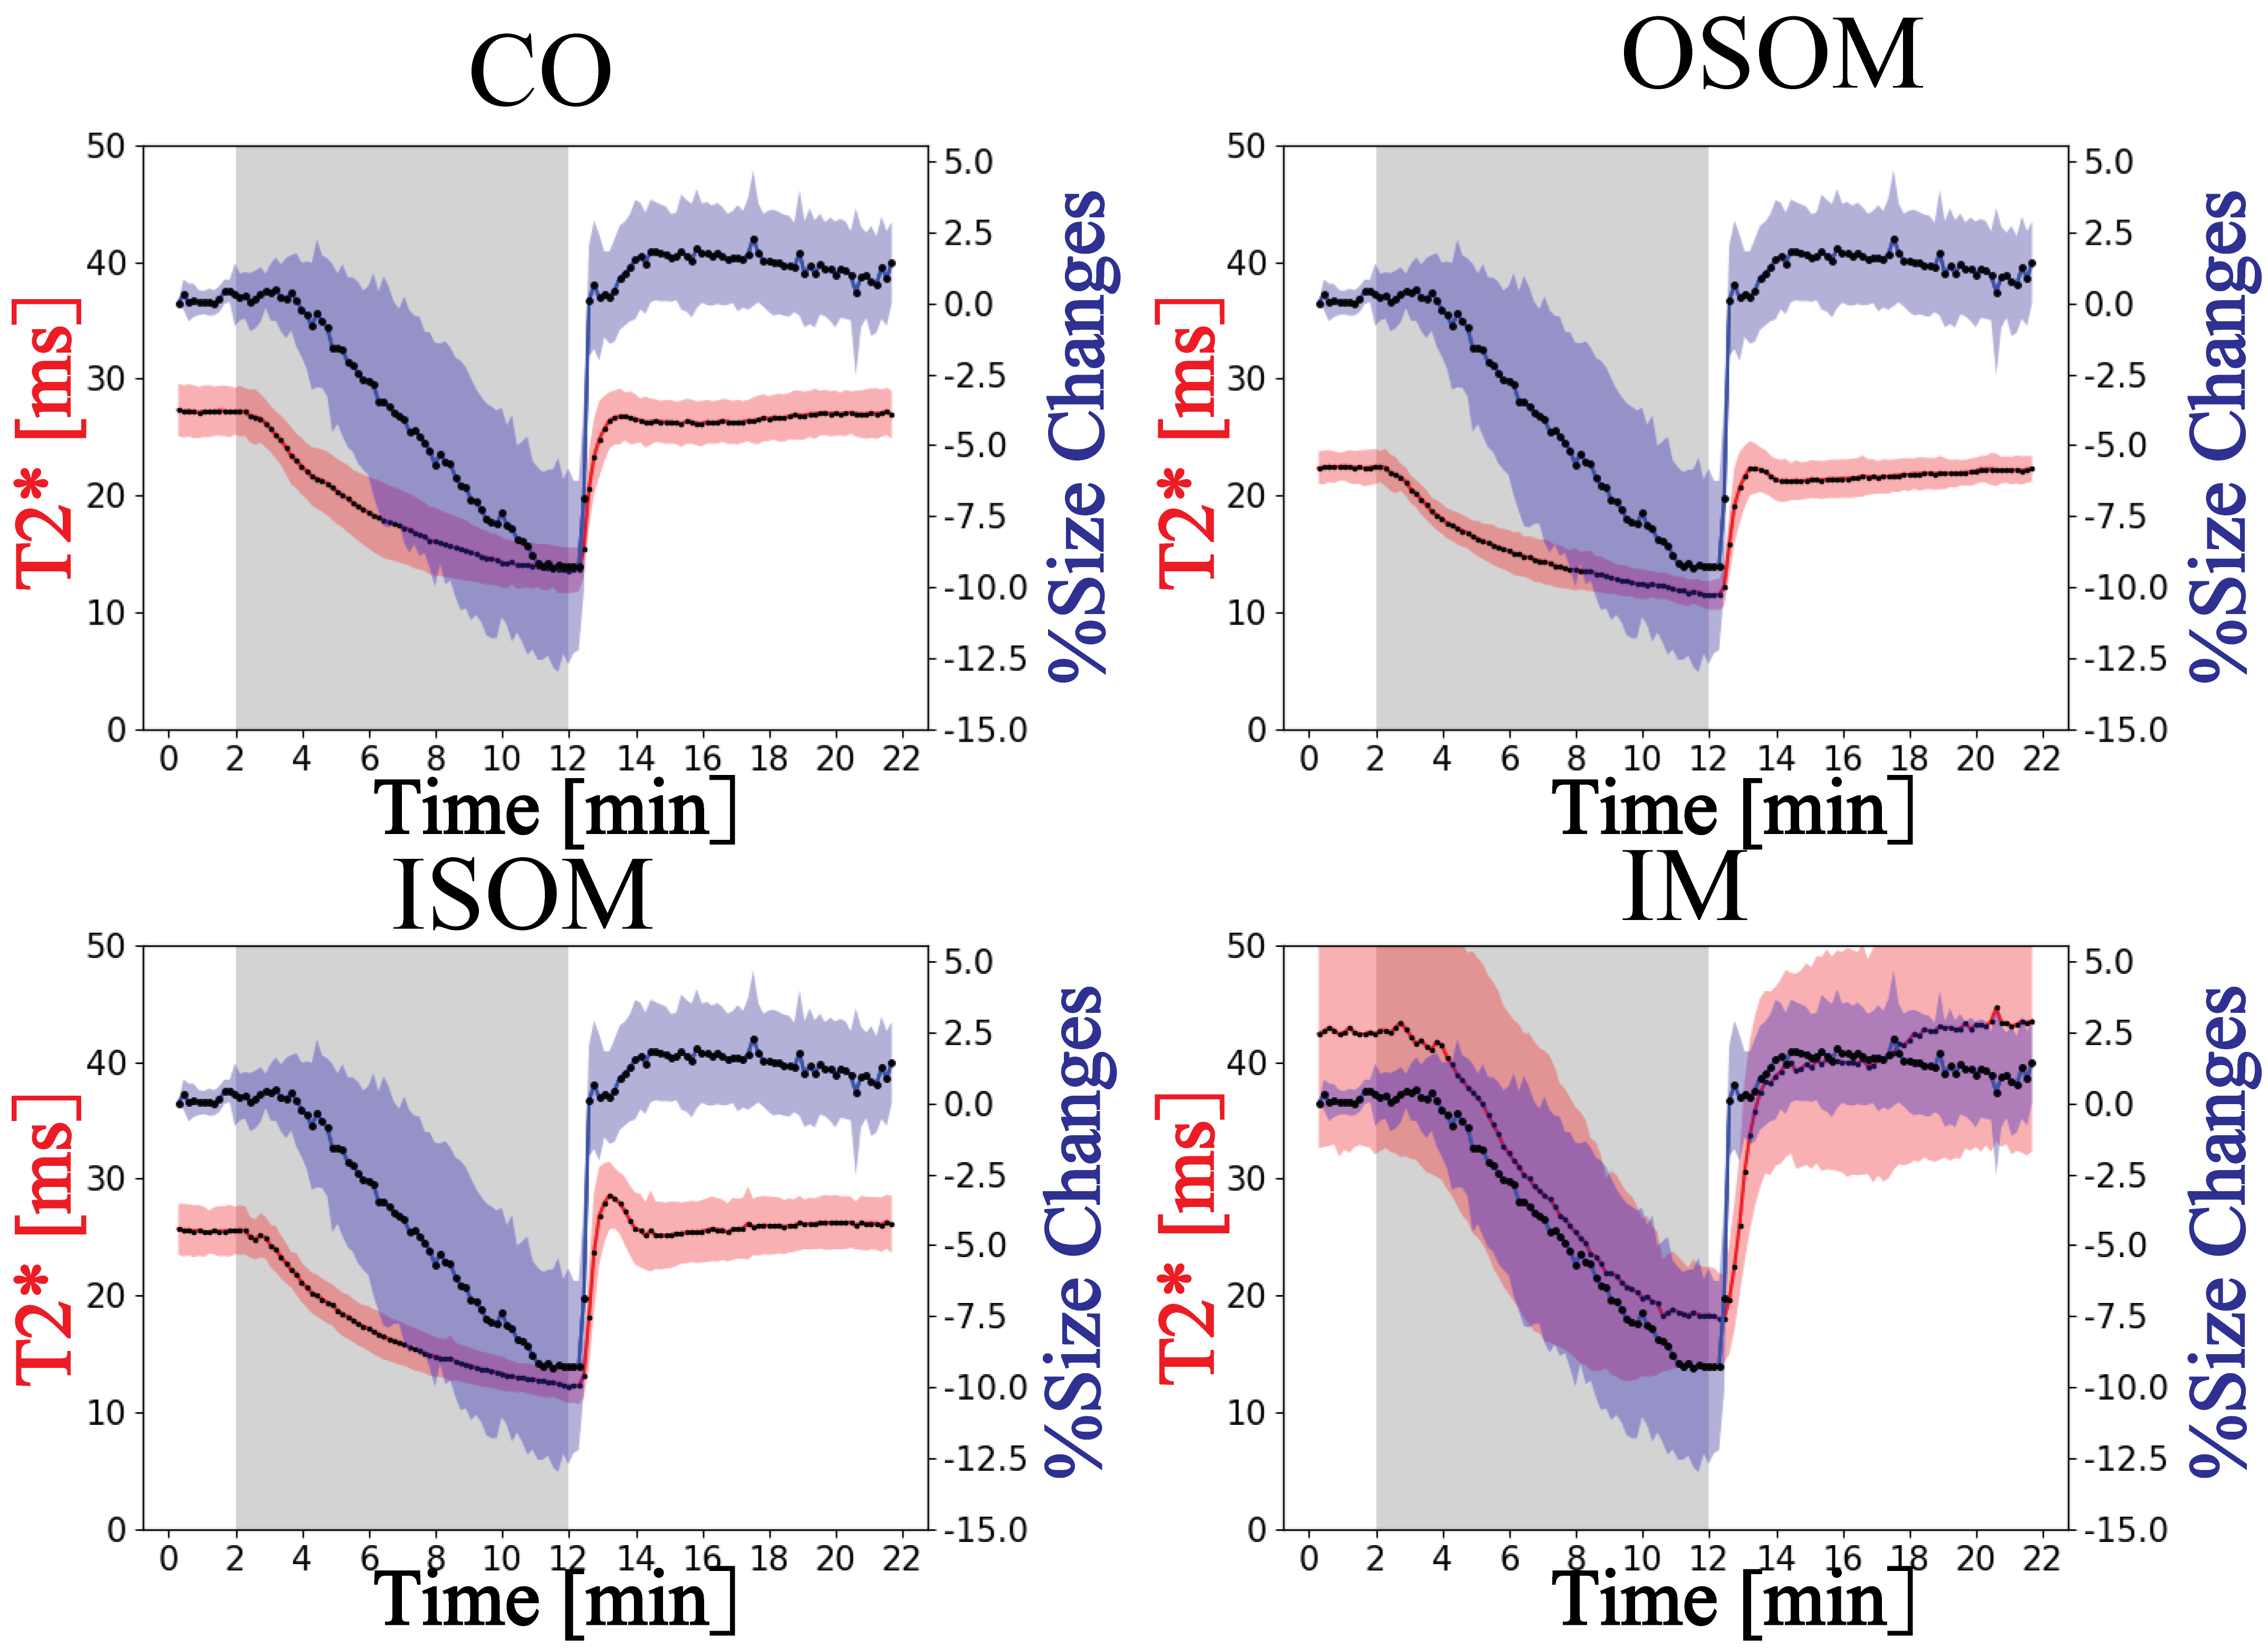
Figure 4. Comparison between renal layer’s
T2* and measured renal size changes.