Mojtaba Jokar1, Ying Wang1,2, Zhijia Jin3, Yan Li3, Zenghui Cheng3, Yu Liu3, Naying He3, Fuhua Yan3, and E. Mark Haacke1,2,3,4,5
1Magnetic Resonance Innovations, Inc., Bingham Farms, MI, United States, 2Department of Radiology, Wayne State University, Detroit, MI, United States, 3Department of Radiology, Ruijin Hospital, Shanghai Jiao Tong University School of Medicine, Shanghai, China, 4Department of Biomedical Engineering, Wayne State University, Detroit, MI, United States, 5Department of Neurology, Wayne State University, Detroit, MI, United States
1Magnetic Resonance Innovations, Inc., Bingham Farms, MI, United States, 2Department of Radiology, Wayne State University, Detroit, MI, United States, 3Department of Radiology, Ruijin Hospital, Shanghai Jiao Tong University School of Medicine, Shanghai, China, 4Department of Biomedical Engineering, Wayne State University, Detroit, MI, United States, 5Department of Neurology, Wayne State University, Detroit, MI, United States
Comparing the template results to the
manual data, yielded excellent DICE similarity coefficients and volume ratios
for the four structures of interest and good agreement between the manual and
template measurements for SN iron content and the NM background mean.
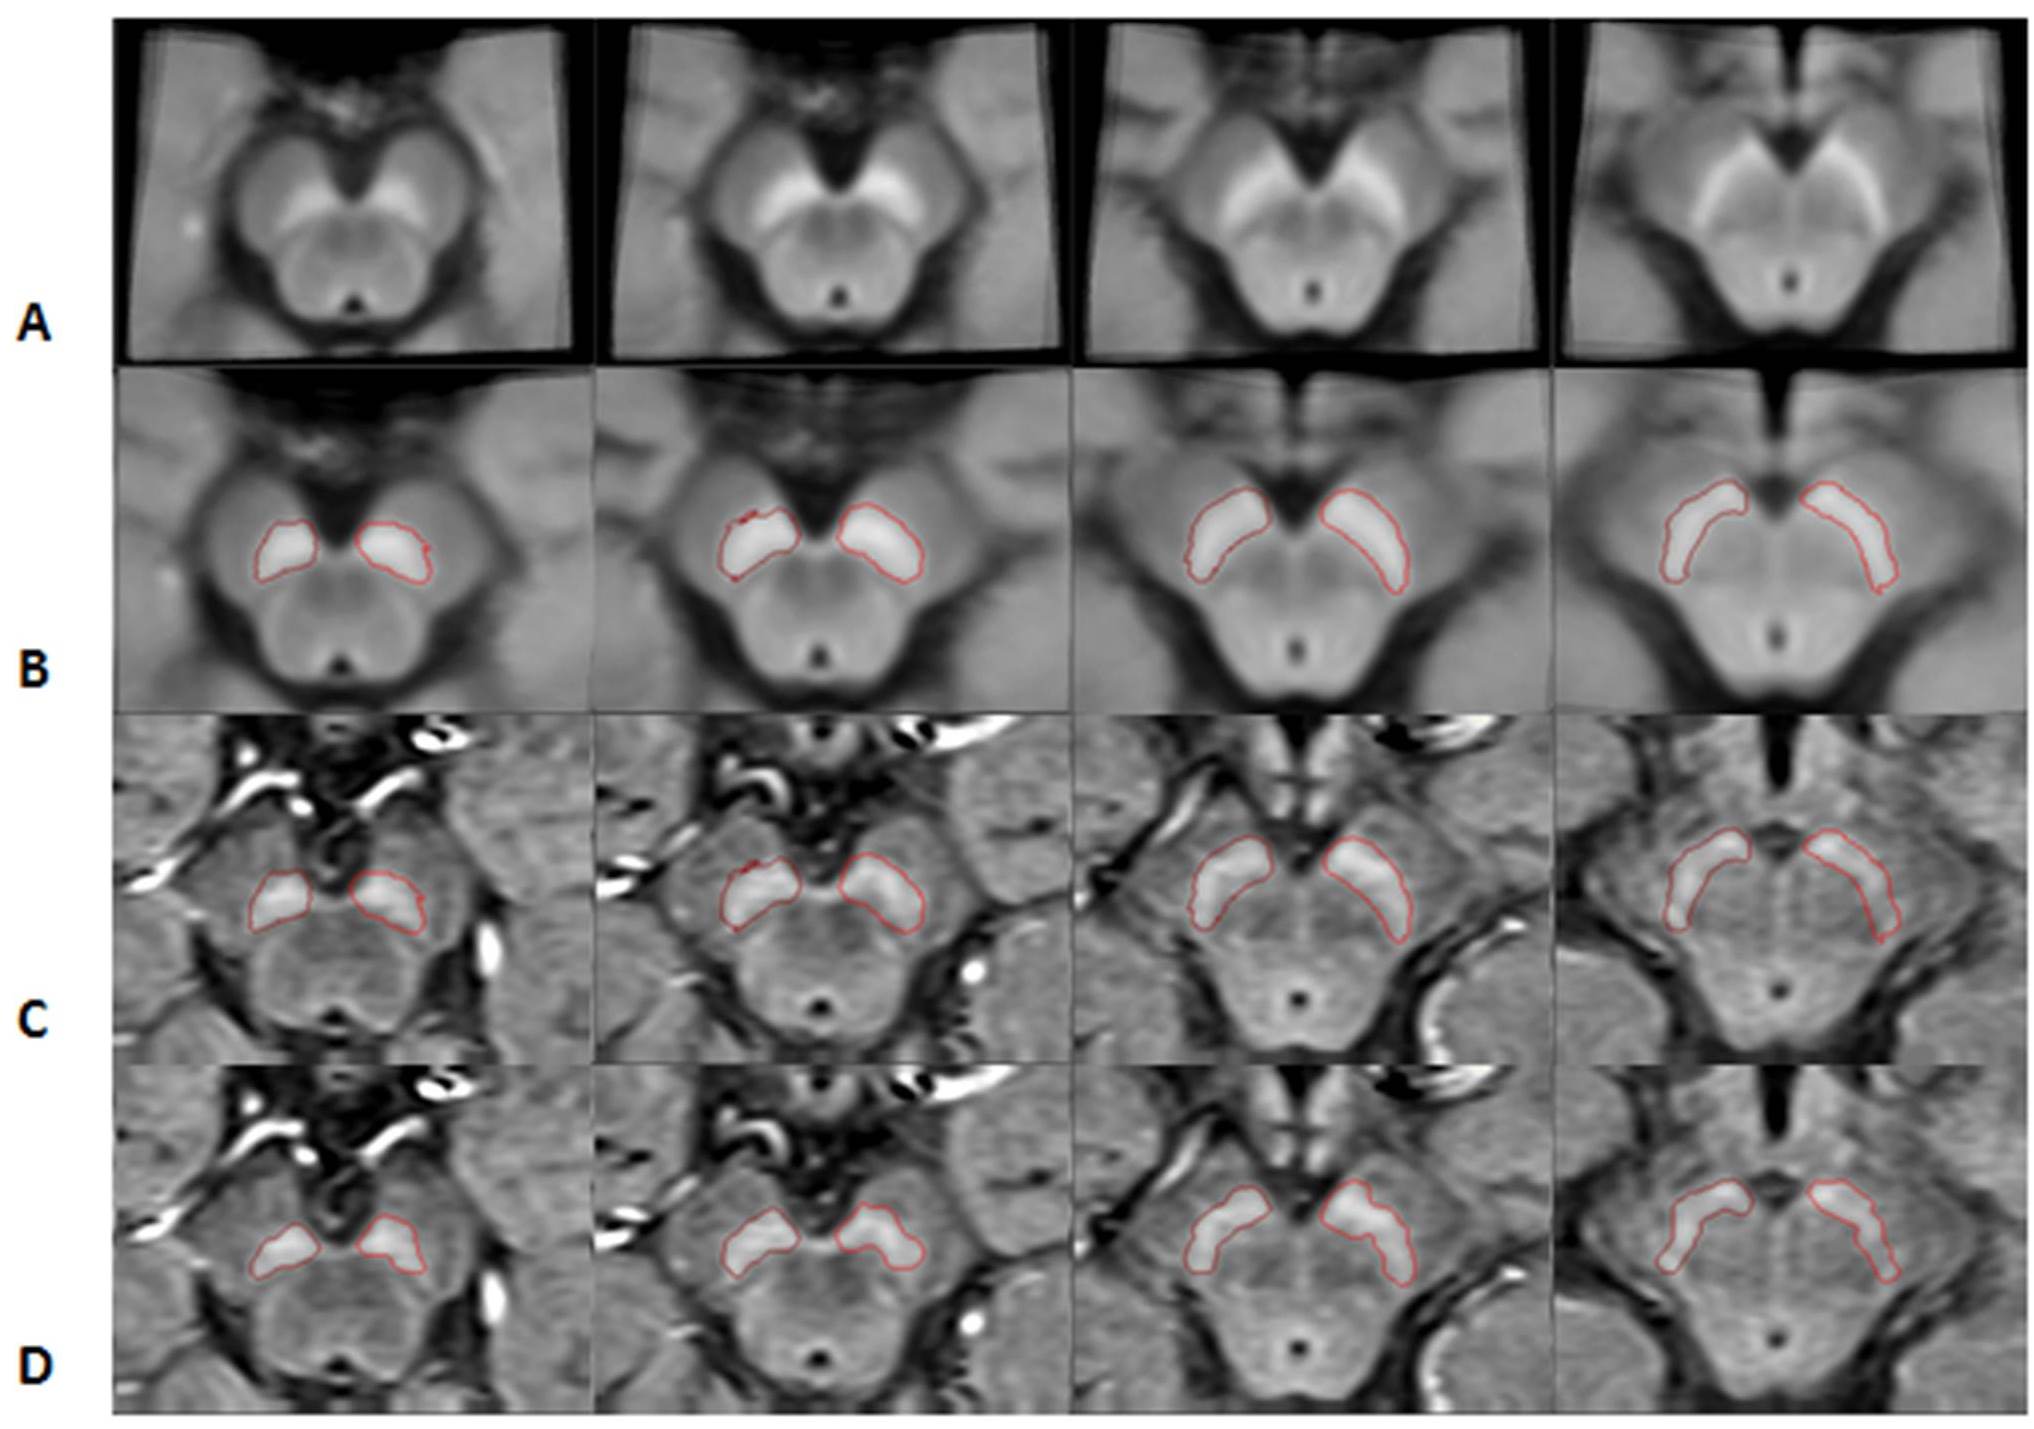
Figure 1.
The stages of mapping the boundaries from the template space to the original
space for neuromelanin. Each column represents a different slice. A) NM
template; B) the transformed NM template; C) the same boundaries superimposed on
the original midbrain images; and D) final boundaries after DPA was used to
refine the boundaries.
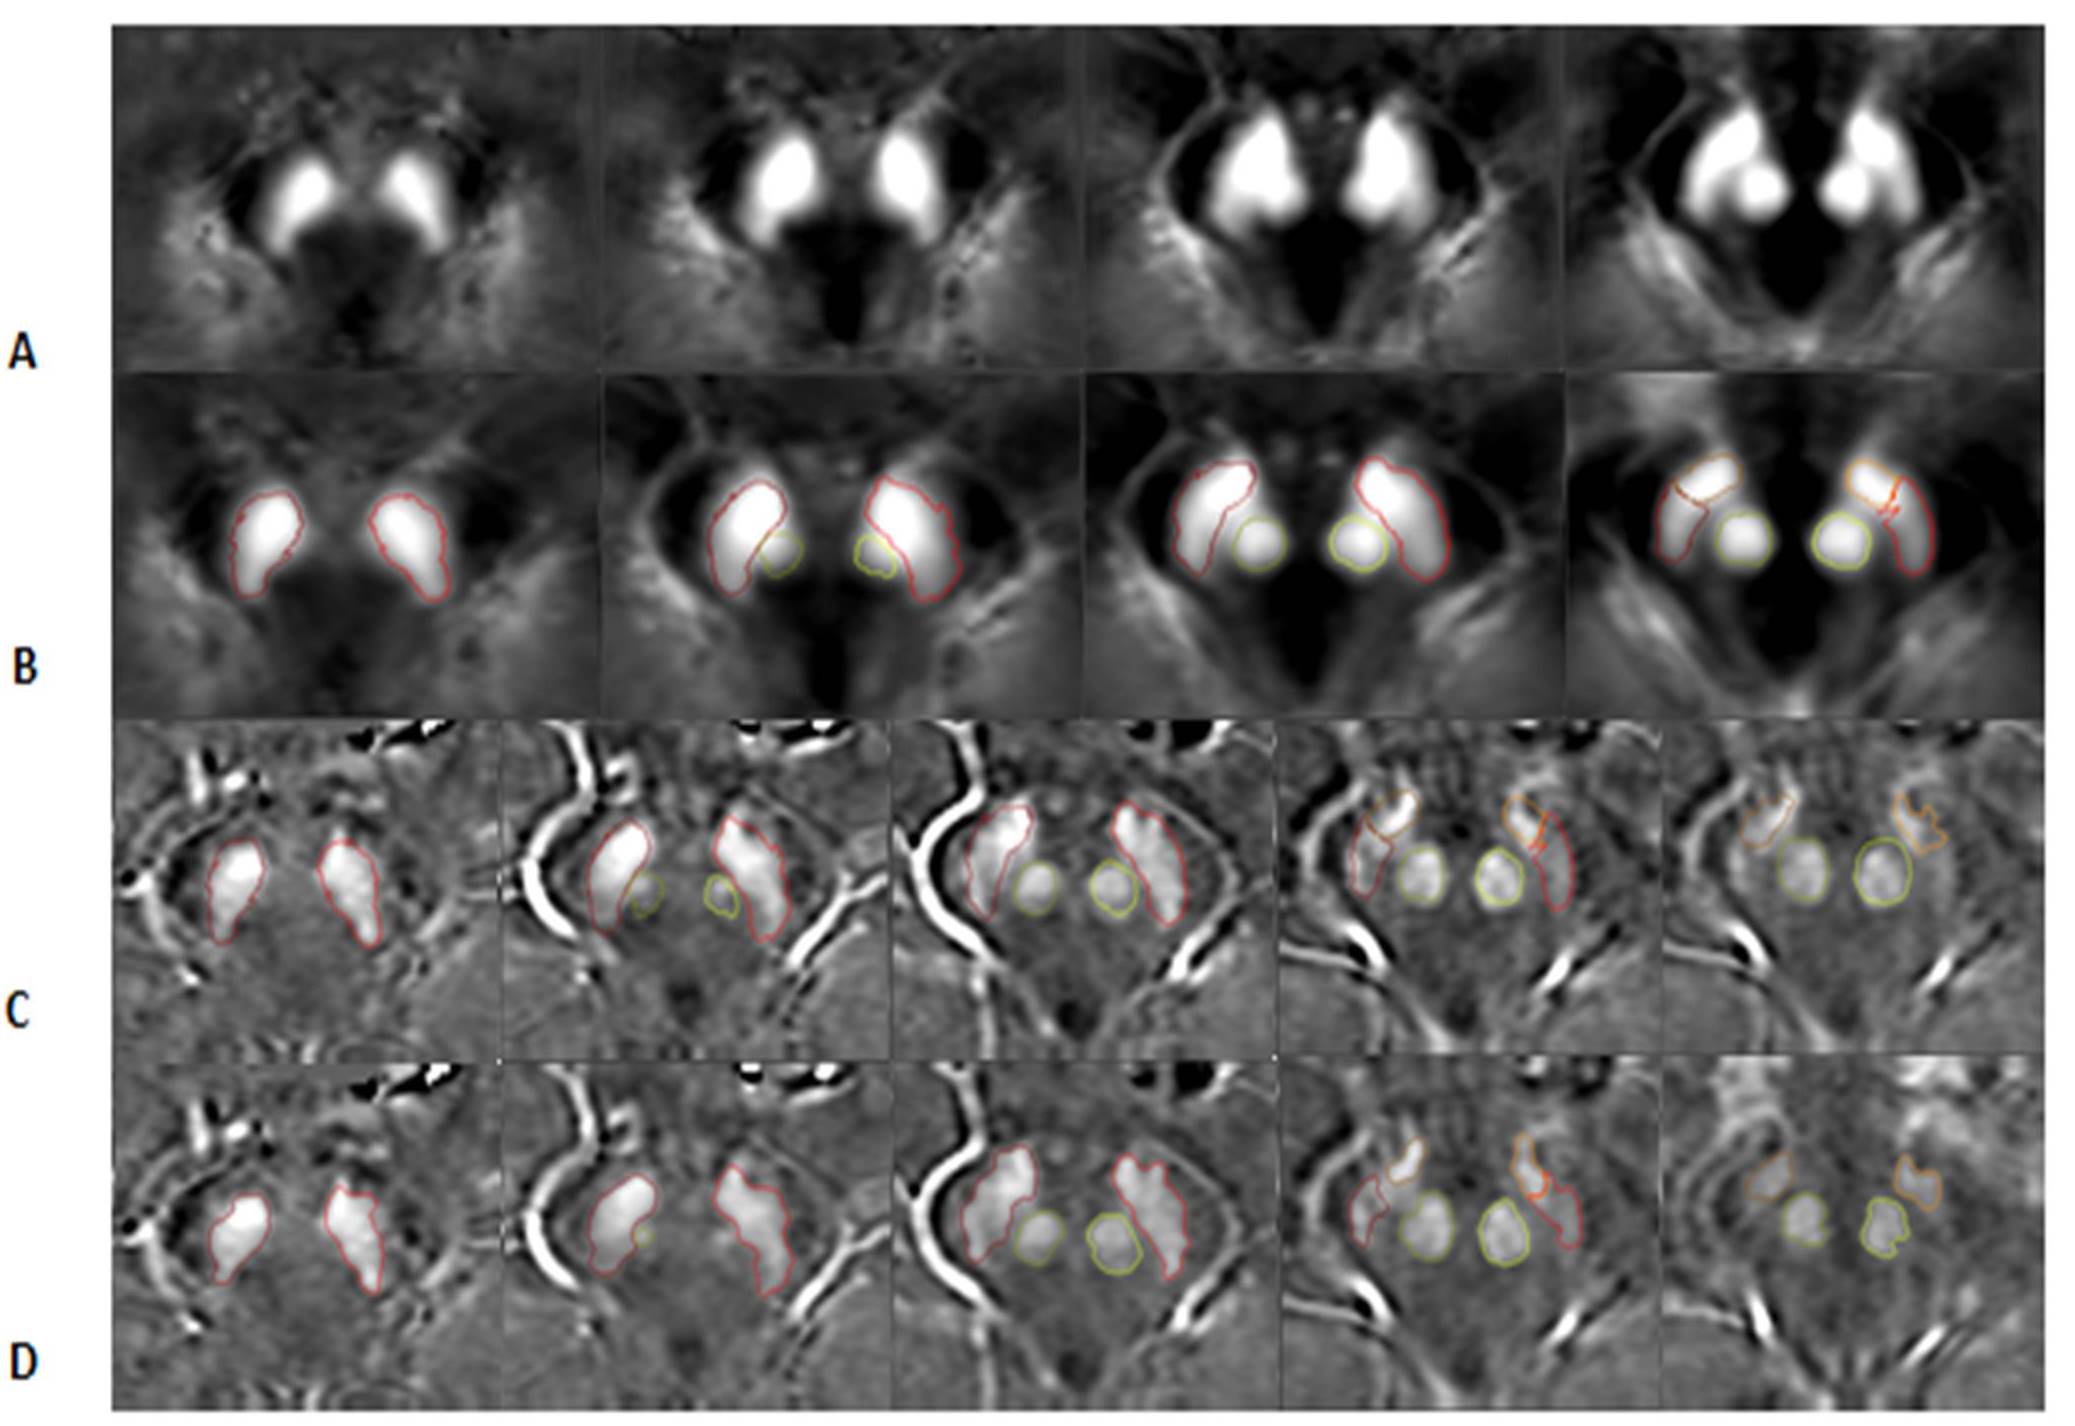
Figure
2.
The stages of mapping the boundaries from the template space to the original
space for the QSM data. Each column represents a different slice. A) the QSM
template; B) the transformed QSM template; C) the same boundaries superimposed
on the original midbrain images; and D) final boundaries after the DPA was used
to refine the boundaries. The fourth and fifth columns show the SN boundary in
red and the STN boundary in orange. The second and third rows show the RN
boundary in light green.