Jae-Hyuk Shim1 and Hyeon-Man Baek1
1Gachon University, Incheon, Korea, Republic of
1Gachon University, Incheon, Korea, Republic of
Segmentation of basal ganglia structures and fiber tracking between basal ganglia segmentations for comparing diffusion measures such a between controls and Parkinson's disease patients shows potential biomarkers for diagnosing PD.
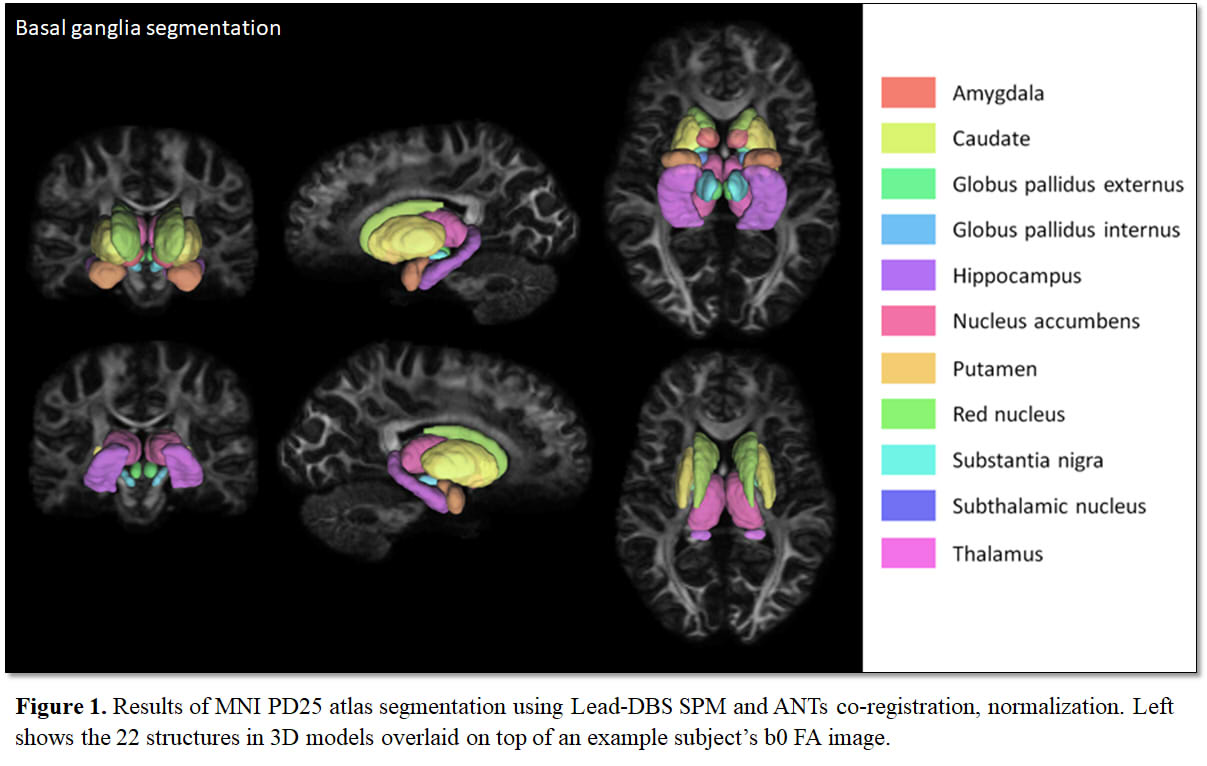
Figure
1. Results of MNI PD25
atlas segmentation using Lead-DBS SPM and ANTs co-registration, normalization. Left
shows the 22 structures in 3D models overlaid on top of an example subject’s b0
FA image.
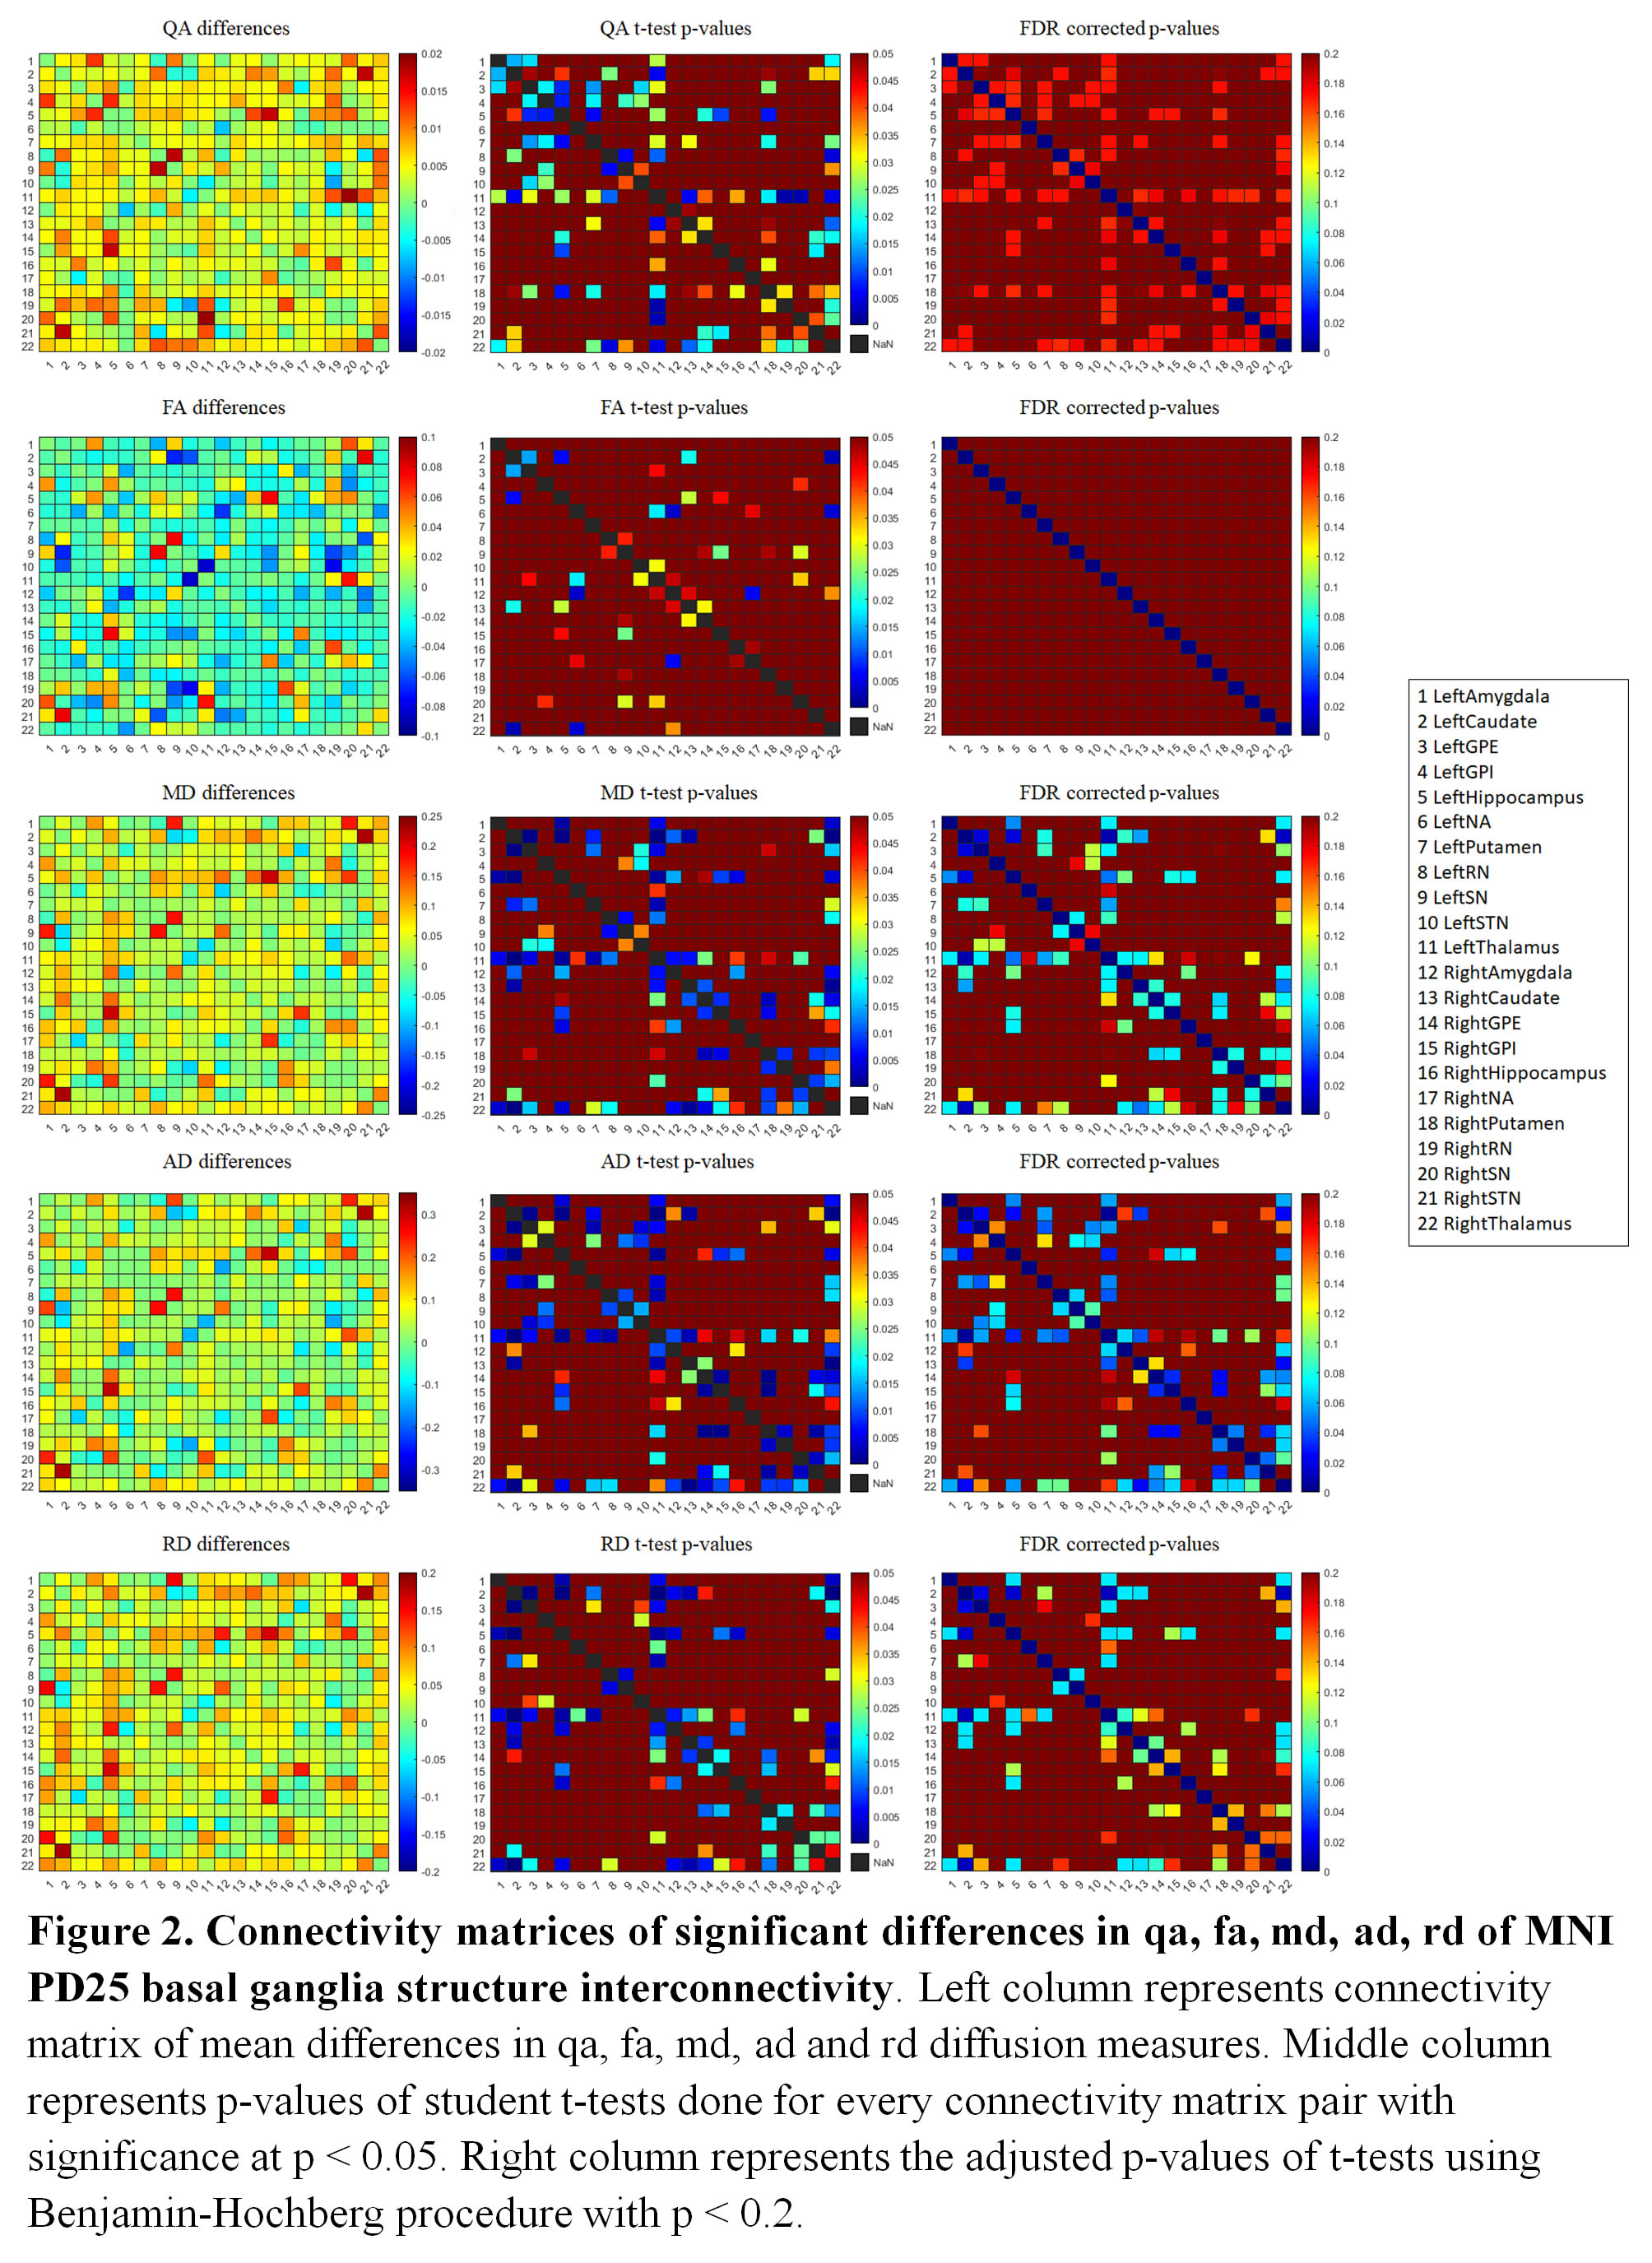
Figure 2.
Connectivity matrices of significant differences in qa, fa, md, ad, rd of MNI PD25
basal ganglia structure interconnectivity. Left column represents connectivity matrix of mean
differences in qa, fa, md, ad and rd diffusion measures. Middle column
represents p-values of student t-tests done for every connectivity matrix pair with
significance at p < 0.05. Right column represents the adjusted p-values of t-tests
using Benjamin-Hochberg procedure with p < 0.2.