Rosa Sanchez Panchuelo1, Olivier Mougin1, Robert Turner1,2, and Susan Francis1,3
1Sir Peter Mansfield Imaging Centre, UP, University of Nottingham, Nottingham, United Kingdom, 2Max Planck Institute for Human Cognitive and Brain Sciences, Leibzig, Germany, 3NIHR Nottingham Biomedical Research, University of Nottingham, Nottingham, United Kingdom
1Sir Peter Mansfield Imaging Centre, UP, University of Nottingham, Nottingham, United Kingdom, 2Max Planck Institute for Human Cognitive and Brain Sciences, Leibzig, Germany, 3NIHR Nottingham Biomedical Research, University of Nottingham, Nottingham, United Kingdom
T1 values measured at 7T with MS-IR-EPI are more accurate than those measured with MP2RAGE. The NIST T2-sphere system is better suited than T1-sphere system for T1-mapping at 7T.
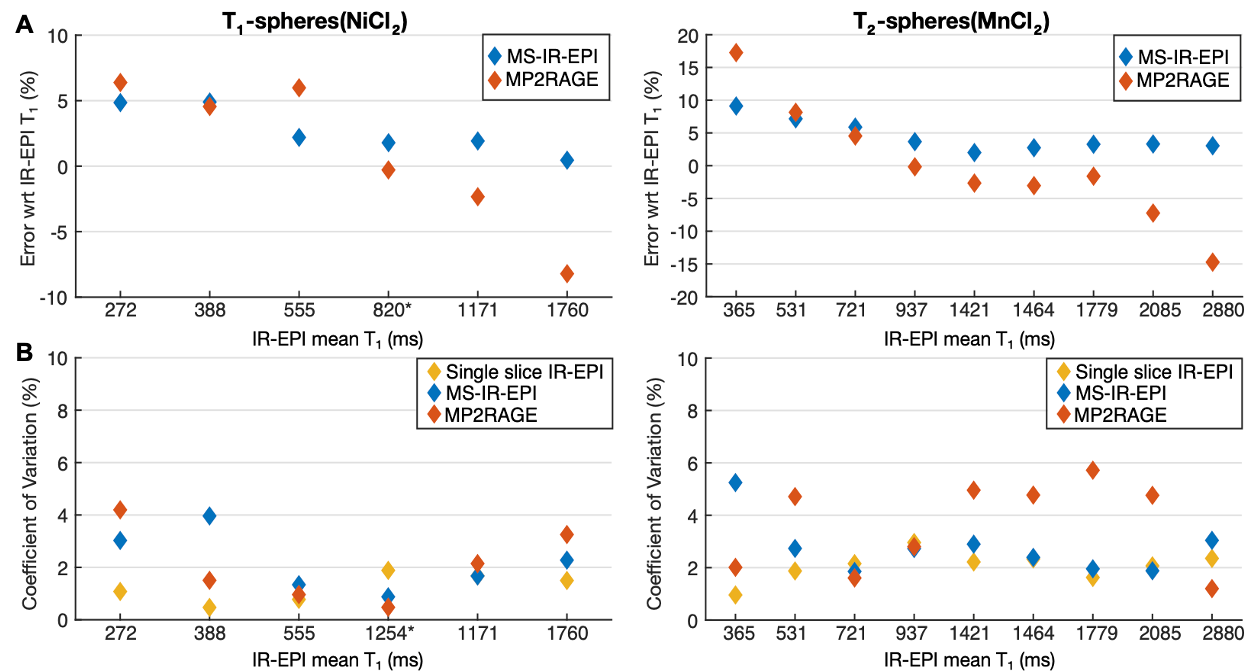
Figure 4: (A) The relative deviation of
MS-IR-EPI and MP2RAGE T1 measurements at 7T with respect to
single slice IR-EPI T1 measurements. T1-value measures averaged across 6
(T1-spheres) and 4 (T2-spheres) measurements. Note that T1 values for the T1_3 sphere are an average across
voxels within a single measurement. (B) Coefficient of variation (CoV) showing the repeatability of T1 measures for methods at 7T. Note that the CoV for T1_3 sphere was computed over the
last 4 measurements.
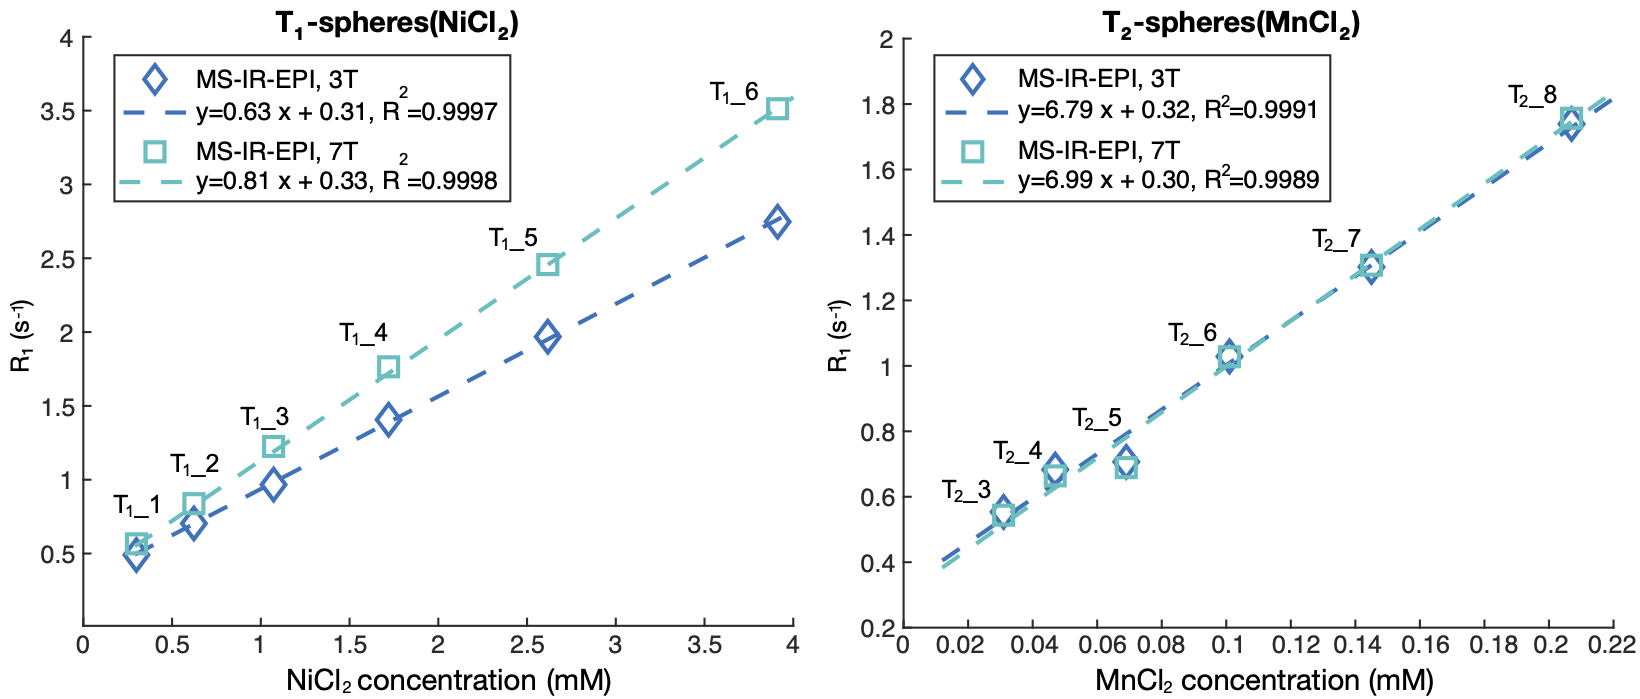
Figure 5: Plots of R1 (s-1) obtained using MS-IR-EPI at 3T and
7T versus the NiCl2 (left) and MnCl2 (right) nominal concentration (mM-1). Dashed lines represent linear
regression fit.