Guangyu Dan1,2, Kaibao Sun1, Qingfei Luo1, and Xiaohong Joe Zhou1,2,3
1Center for MR Research, University of Illinois at Chicago, Chicago, IL, United States, 2Department of Bioengineering, University of Illinois at Chicago, Chicago, IL, United States, 3Departments of Radiology and Neurosurgery, University of Illinois at Chicago, Chicago, IL, United States
1Center for MR Research, University of Illinois at Chicago, Chicago, IL, United States, 2Department of Bioengineering, University of Illinois at Chicago, Chicago, IL, United States, 3Departments of Radiology and Neurosurgery, University of Illinois at Chicago, Chicago, IL, United States
T1, T2*, and ADC can be quantitatively
mapped using a single pulse sequence based on a diffusion-weighted stimulated
echo sequence with multiple EPI readouts. This technique has been demonstrated in
the brain and the prostate of healthy human subjects.

Figure 1. A diagram of the
stimulated multi-echo-train EPI sequence. This sequence is based on a
diffusion-weighted stimulated echo, and employs multiple EPI echo-train readouts
at and after the peak of the stimulated echo. Each echo train
corresponds to a different effective TE. A collection of the echo trains can be
used to calculate T2*. Gss, Gdiff,
GTM are the slice-selection, diffusion-weighted, and spoiling
gradients, respectively. ET denotes echo train.

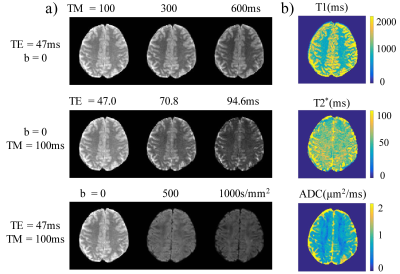
Figure
2. (a) Brain images acquired with the stimulated multi-echo-train EPI sequence
in Figure 1 from a healthy subject using three TMs (first row), three TEs
(second row), and three b-values (last row). (b) T1, T2*, and
ADC maps obtained from the corresponding row of images in (a). The numerical scales
are shown on the right with the units indicated on top of each color map.
