Peter Seres1, Kelly C McPhee1,2, Emily Stolz1, Julia Rickard1, Jeff Snyder1, Christian Beaulieu1, and Alan H Wilman1
1Biomedical Engineering, University of Alberta, Edmonton, AB, Canada, 2CancerCare Manitoba, Winnipeg, MB, Canada
1Biomedical Engineering, University of Alberta, Edmonton, AB, Canada, 2CancerCare Manitoba, Winnipeg, MB, Canada
T2
mapping from a proton density and T2-weighted image using a Bloch simulation
based fitting model and accounting for actual flip angles enables highly
repeatable T2 measures of human brain across the lifespan.
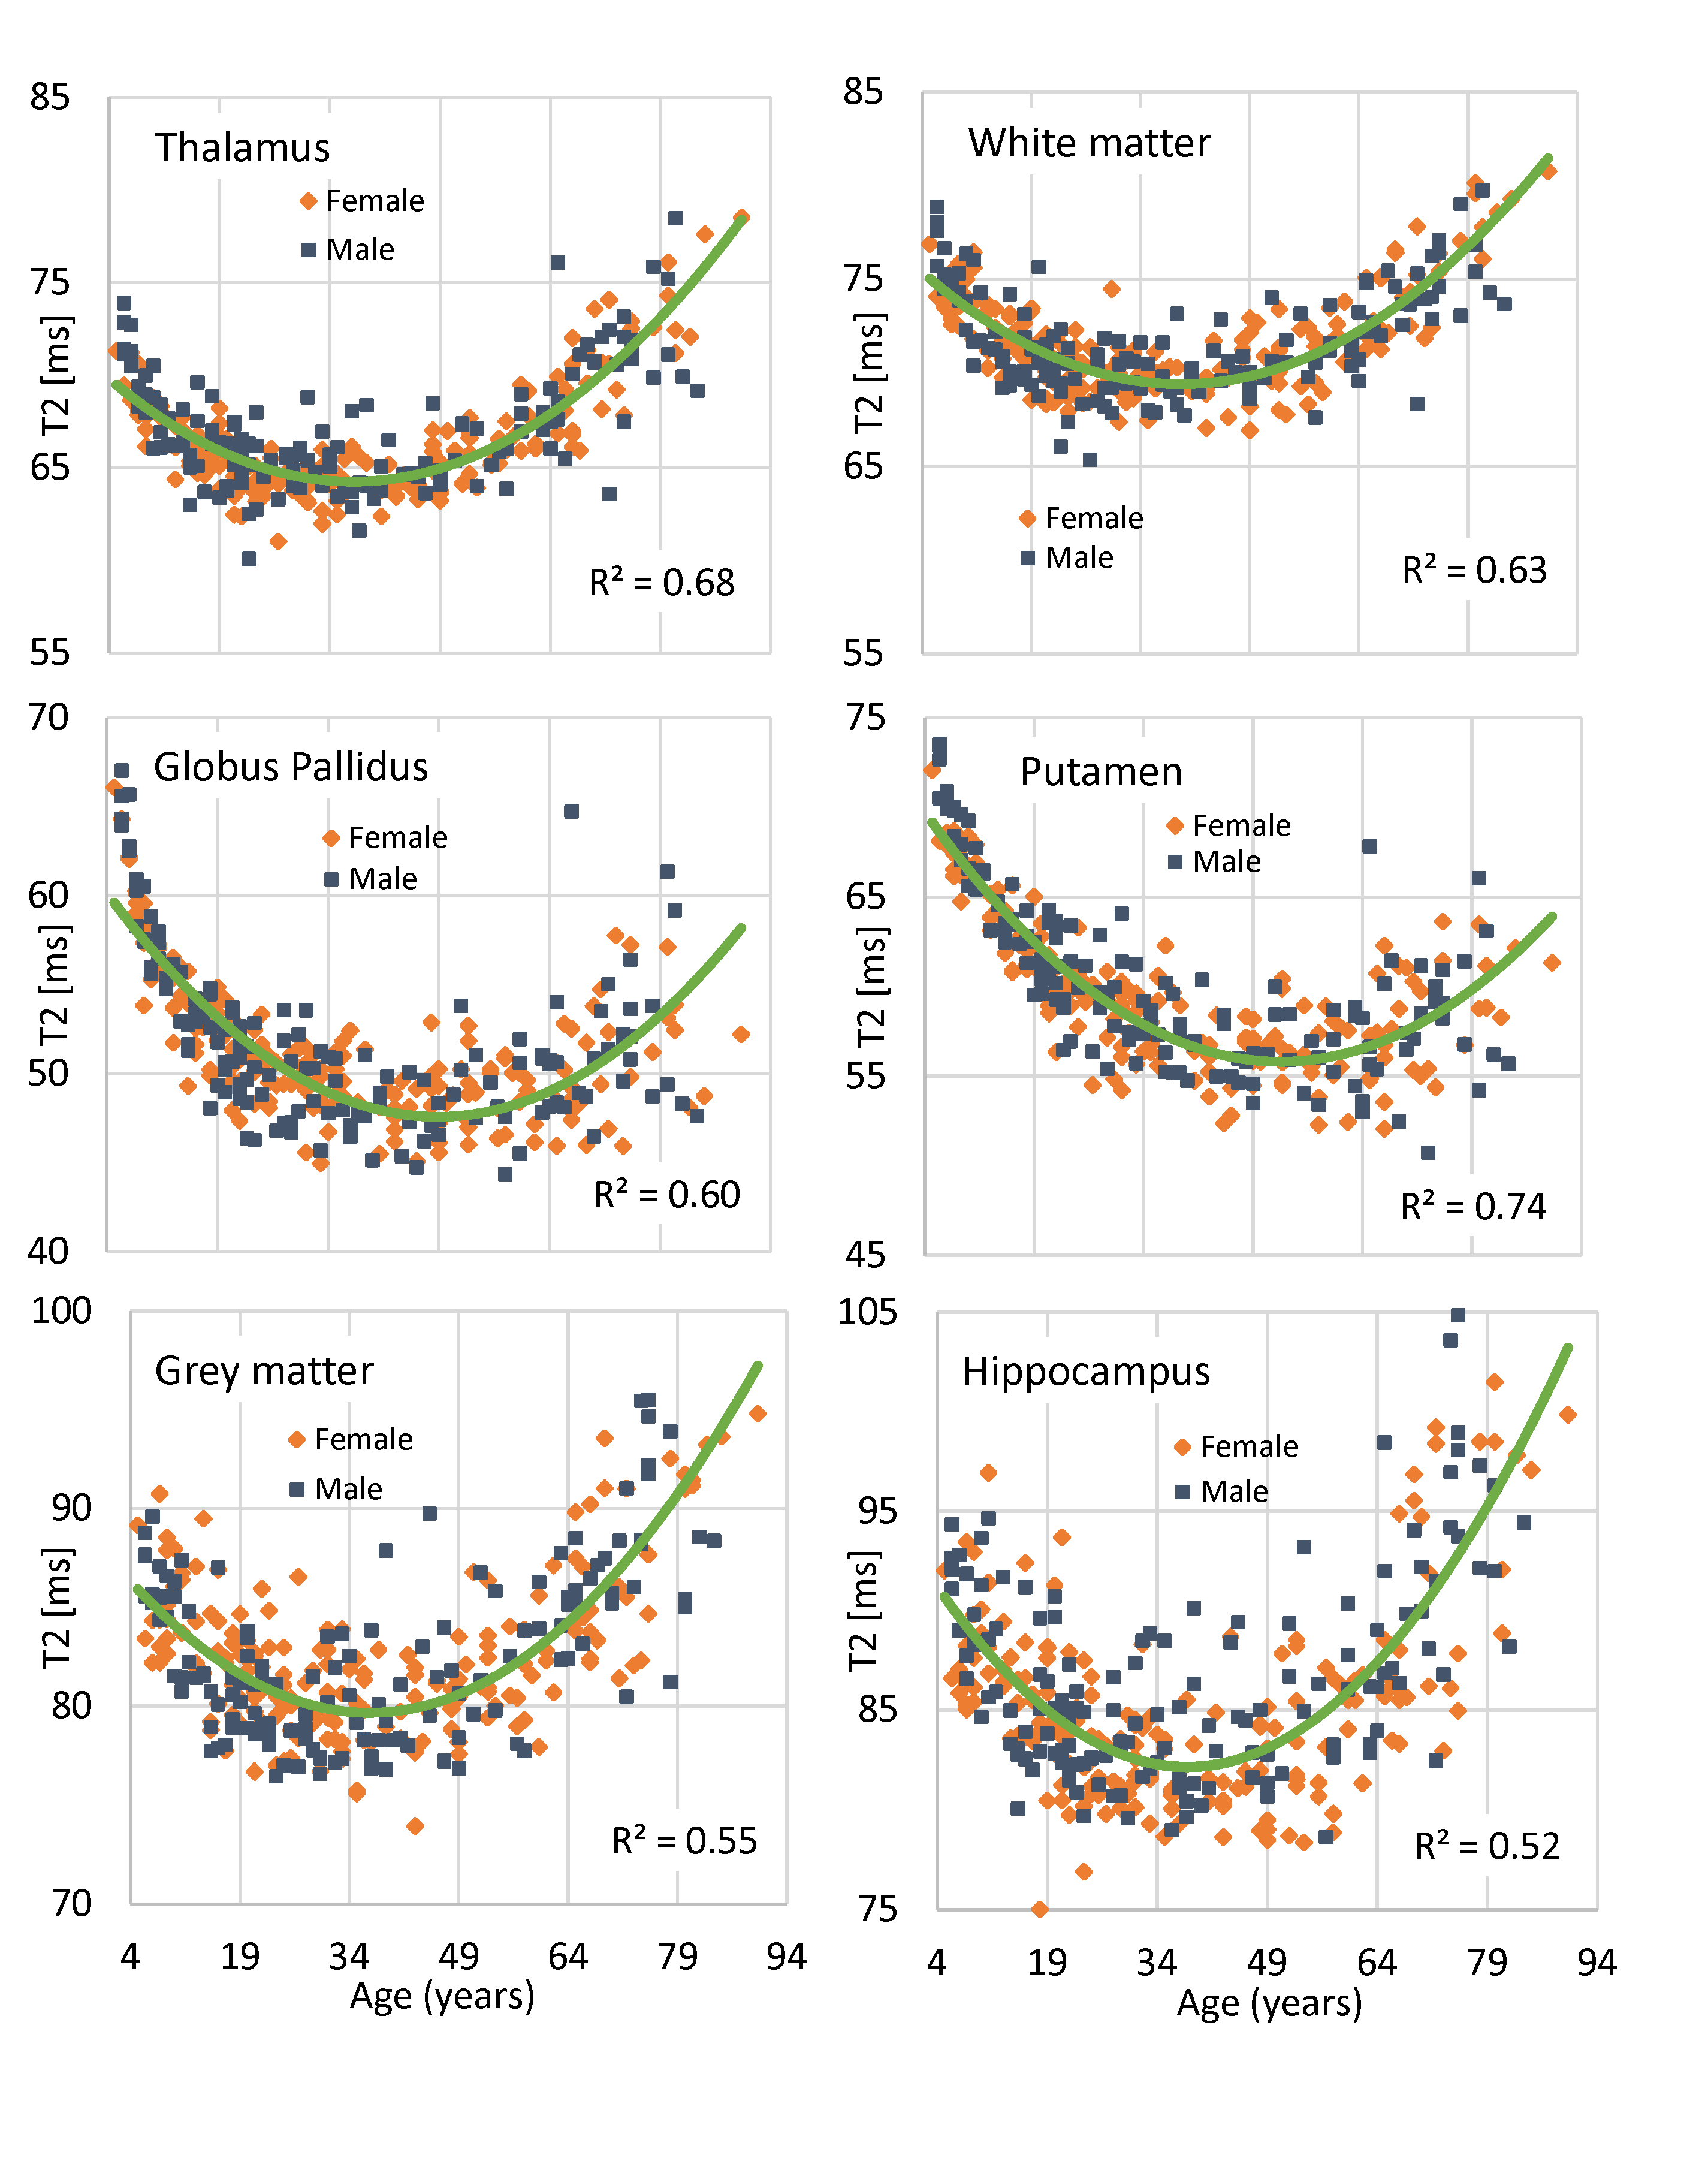
Figure 5: Lifespan changes in T2 in females (red) and males
(blue). The y-axes are different, although all cover a range of 30 ms. In early
age, T2 decline relates to myelination and iron accumulation. In late life, T2
increases largely due to tissue loss, often exceeding the T2 values of
childhood, except in iron-rich regions like putamen and globus pallidus. The
green lines are 2nd order polynomial fits (T2 =A*age2 +
B*age + C). R-squared values are shown.
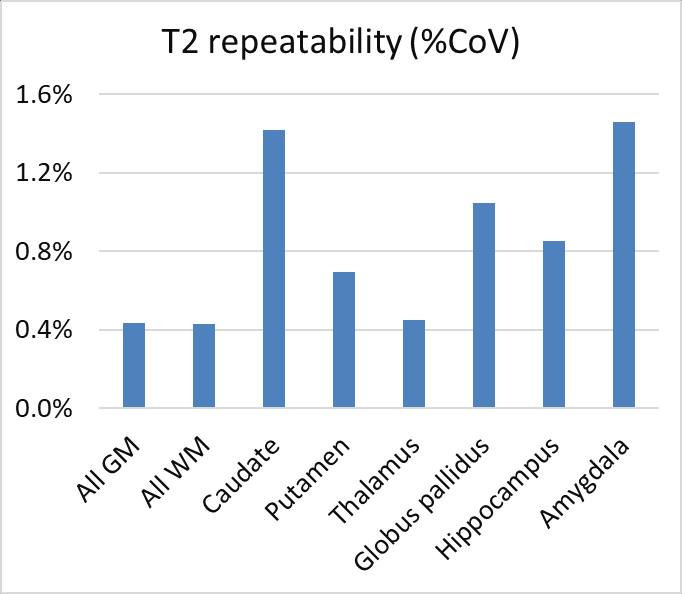
Figure 4: Coefficients of variation (CoV) for scan-rescan T2 measurement using
Bloch fitting. The CoVs are remarkably
low and also include some errors due to segmentation. For example, the amygdala has the worst
performance at 1.4%, likely due to its small size affecting segmentation. These
results indicate a high level of consistency between T2 maps acquired over
multiple days. This degree of repeatability is possible because the exact
sequence is modelled, accounting for actual flip angles used in each voxel.