Thomas O'Reilly1 and Andrew Webb1
1C.J. Gorter Center for High Field MRI, Leiden University Medical Center, Leiden, Netherlands
1C.J. Gorter Center for High Field MRI, Leiden University Medical Center, Leiden, Netherlands
In this work we present in-vivo T1 and T2 relaxation maps of the brain and lower leg acquired on a 50 mT MRI scanner. Measured the T1 times are typically shorter and the T2 times are somewhat longer than those reported at high field.
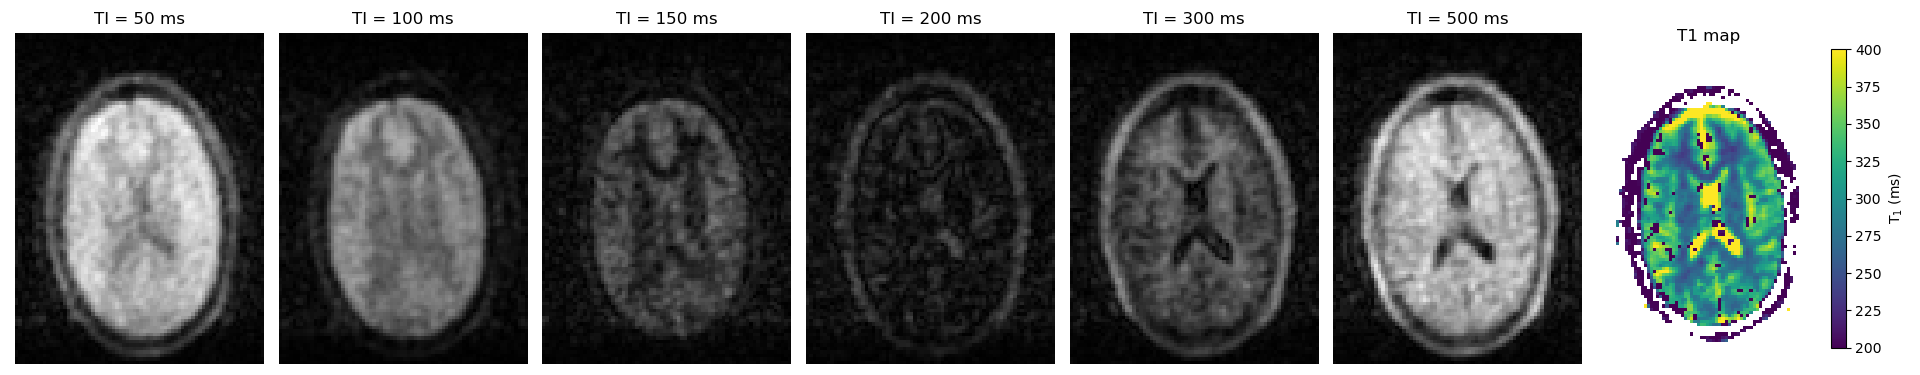
Figure 1. Left) A transverse slice from a
3D dataset as a function of increasing inversion times (note that the CSF
appears hypointense due to saturation, TR<<T1). Right) A T1
map is generated by fitting a mono-exponential inversion recovery relaxation
curve to the images. The T1 of grey and white matter are measured to
be 330 ± 26 ms and 242 ± 41, respectively.
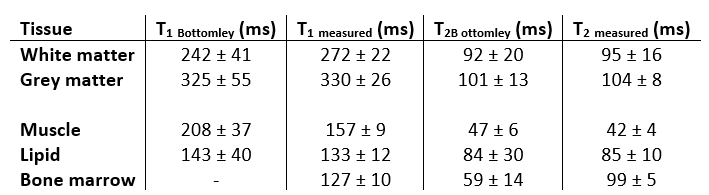
Figure 5. The relaxation parameters
measured in this work are compared to ex-vivo values reported in the literature
(8), with generally good agreement between the two with some differences in the
muscle T1 and bone marrow T2.