Amy R. McDowell1, Stephen J. Wastling1,2, Lara Cristiano3, Jasper M. Morrow1, Matthew R.B. Evans4, Christopher D.J. Sinclair1, Pedro M. Machado1, Michael Hanna1, Mary M. Reilly1, Tarek Yousry1, and John S. Thornton1
1MRC Centre for Neuromuscular Diseases, UCL Queen Square Institute of Neurology, London, United Kingdom, 2Lysholm Department of Neuroradiology, National Hospital for Neurology and Neurosurgery, London, United Kingdom, 3Department of Pediatric Neurology and Radiology, Fondazione Policlinico Universitario, Rome, Italy, 4St Thomas Hospital, London, United Kingdom
1MRC Centre for Neuromuscular Diseases, UCL Queen Square Institute of Neurology, London, United Kingdom, 2Lysholm Department of Neuroradiology, National Hospital for Neurology and Neurosurgery, London, United Kingdom, 3Department of Pediatric Neurology and Radiology, Fondazione Policlinico Universitario, Rome, Italy, 4St Thomas Hospital, London, United Kingdom
The IDEAL-CPMG sequence was acquired in healthy volunteers and two different muscular
dystrophy disease types to obtain quantitative T2-water maps
uncontaminated by the T2-fat signal. It was found that elevated T2-water may be a
predictor of later progression to fatty-atrophy in muscle
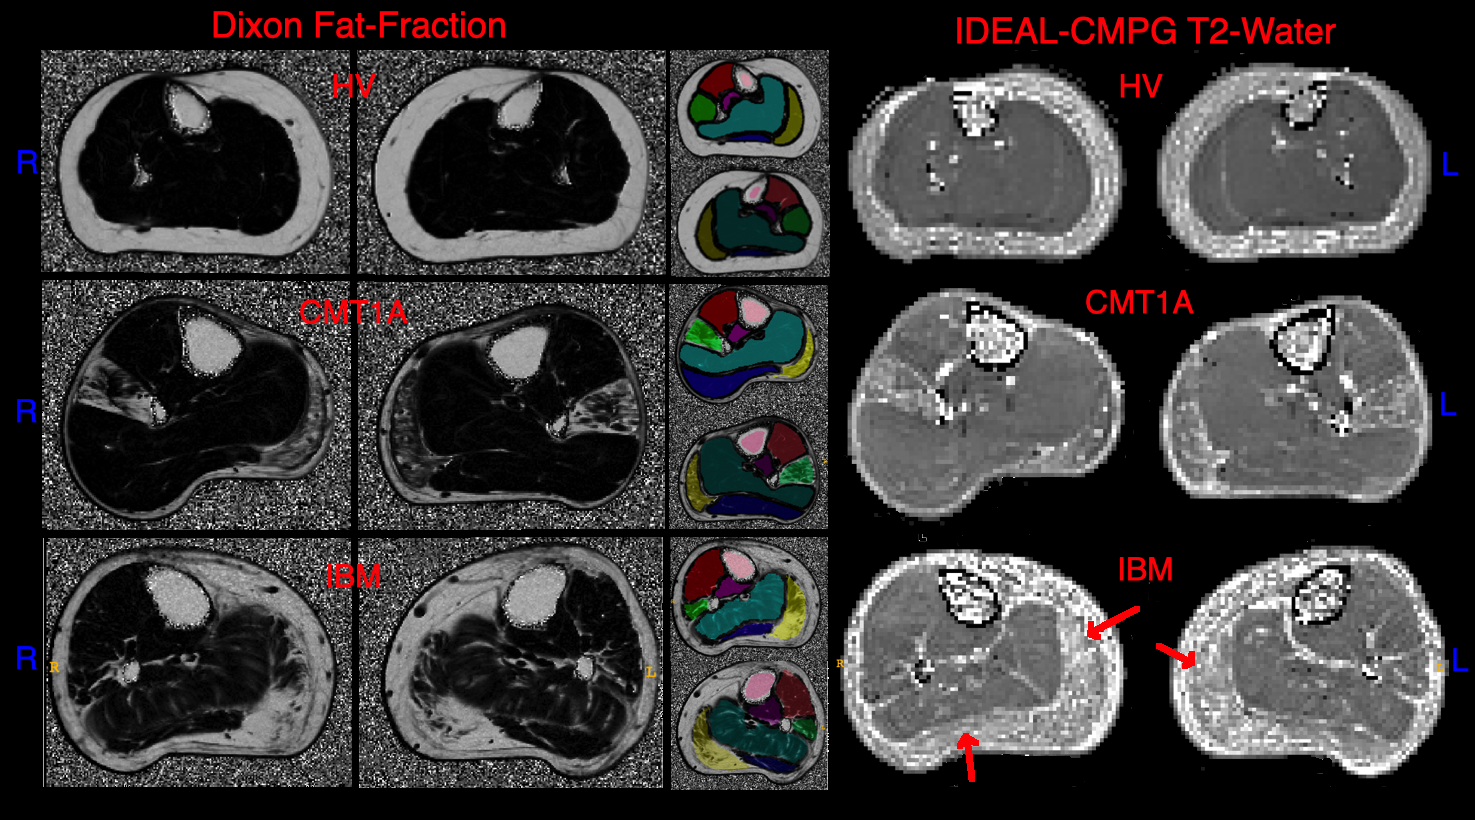
Figure 1: Example Dixon and IDEAL-CPMG
T2-water maps in a healthy volunteer (HV), a person with CMT (CMT1A) and a
person with IBM (IBM). Segmentation ROIs are shown in the centre. Tibialis
Anterior – red, Tibialis Posterior – dark pink, Medial Gastrocnemius – yellow,
Peroneus Longus – green, Soleus – blue, Lateral Gastrocnemius – purple. Red
arrows indicate areas of raised T2 corresponding to oedema. Areas of high fat
such as the bone marrow yield noise in the T2-water maps as there is insufficient
water in this area for accurate estimation.
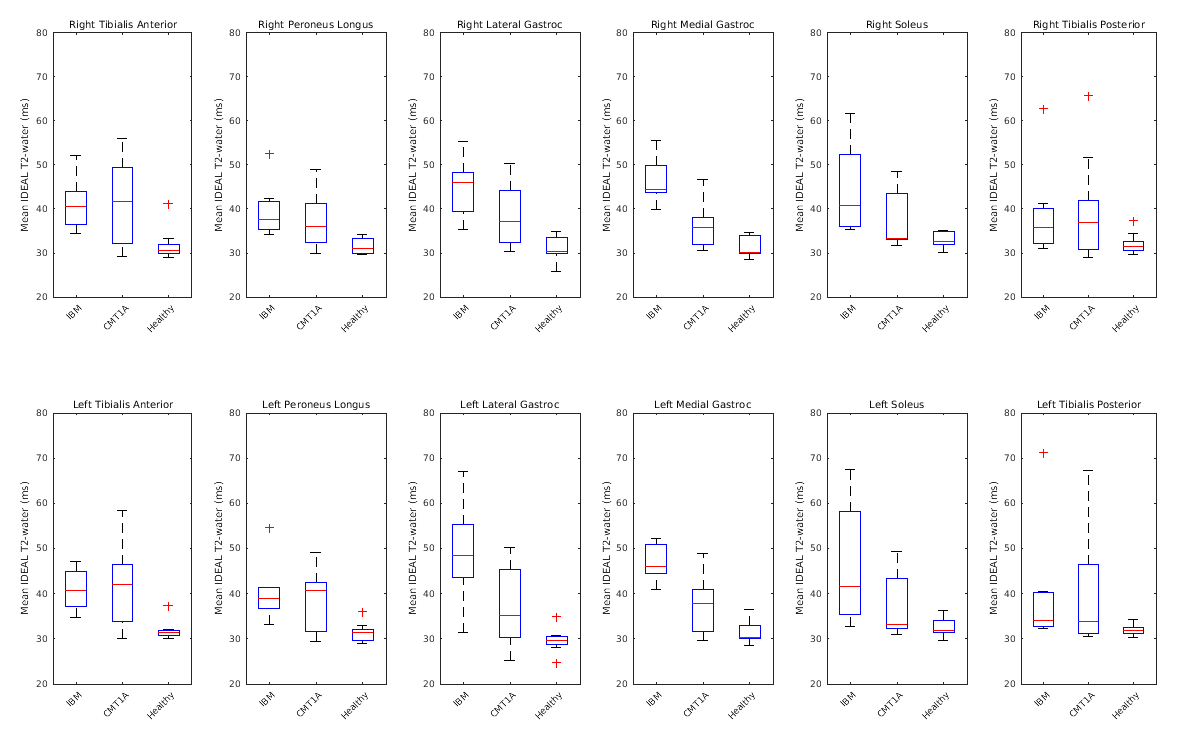
Figure 2: Box plots of T2-Water in individual
muscle ROIs by disease type. The central mark indicates the median, and the
bottom and top edges of the box indicate the 25th and 75th percentiles,
respectively. Whiskers are min and max. T2-water values show a narrower range
in comparison to Dixon-FF% in each disease, especially in the medial and
lateral Gastrocnemius, Dixon-FF% has a wider spread of fat fractions for both
diseases. T2-water gives a more definitive separation of disease type and may
show a higher specificity in a larger cohort.