Yan Xiong1, Weiyin Vivian Liu 2, Fan He1, Yanan Wang1, Yao Zhang1, Shuang Hu1, and Xiaoming Li1
1Wuhan Tongji Hospital, Wuhan, China, 2MR Research, GE Healthcare, Beijing, China
1Wuhan Tongji Hospital, Wuhan, China, 2MR Research, GE Healthcare, Beijing, China
Using histogram analysis of IDEAL-IQ and bi-component analysis of UTE sequence to study chronic kidney disease-Mineral bone disease
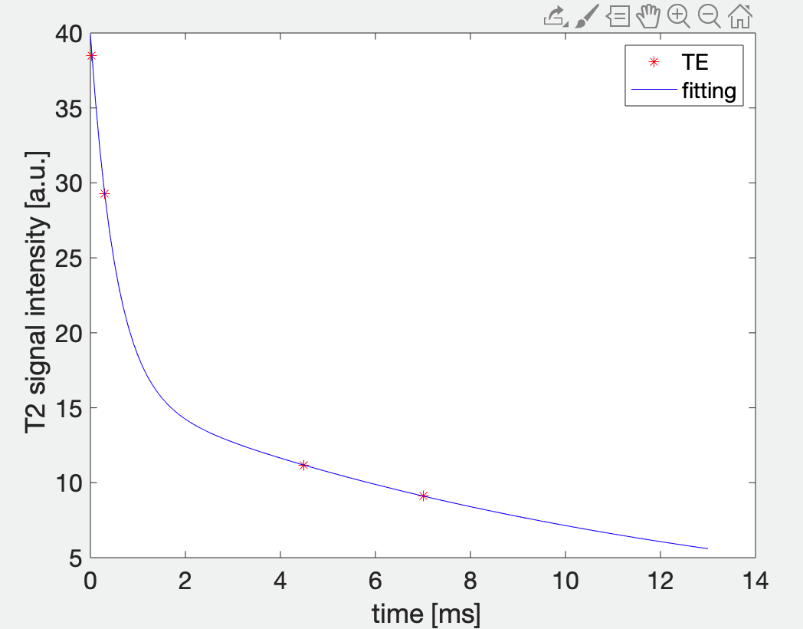
Figure 2. Representative bi-component analysis of UTE on L4 with four echoes.
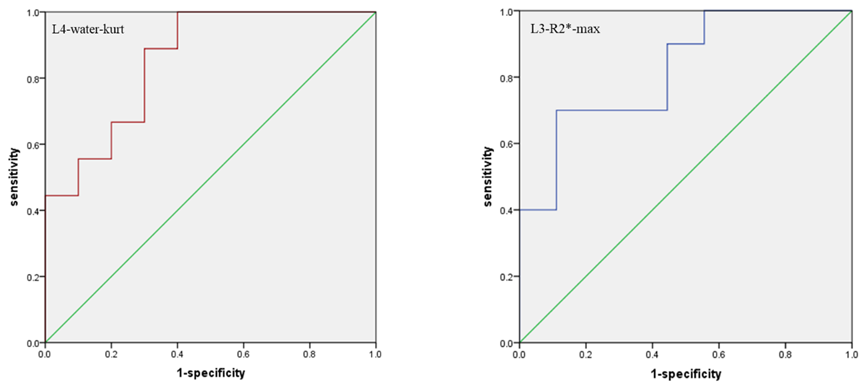
Figure 3 ROC curve
of lumbar bone marrow IDEAL-IQ for differentiating patients with 30 < eGFR
< 90 from patients with eGFR < 15. The area under the curve [AUC] of L4-water-kurt and
L3-R2*-max were 0.856 (p= 0.009) and 0.822 (p= 0.018),
respectively. Abbreviations: L4-water-kurt, kurtosis of water image in
L4; L3-R2*-max, maximum R2* value in L3