Anke Balasch1, Hao Li2, Patrick Metze1, Alireza Abaei2, and Volker Rasche1
1Department of Internal Medicine II, Ulm University Medical Center, Ulm, Germany, Ulm, Germany, 2Core Facility Small Animal Imaging (CF-SANI), Ulm University, Ulm, Germany, Ulm, Germany
1Department of Internal Medicine II, Ulm University Medical Center, Ulm, Germany, Ulm, Germany, 2Core Facility Small Animal Imaging (CF-SANI), Ulm University, Ulm, Germany, Ulm, Germany
The study showed the feasibility of the
combination of the tyGA technique with the single bolus Gd injection to qualitative
assess lung perfusion.
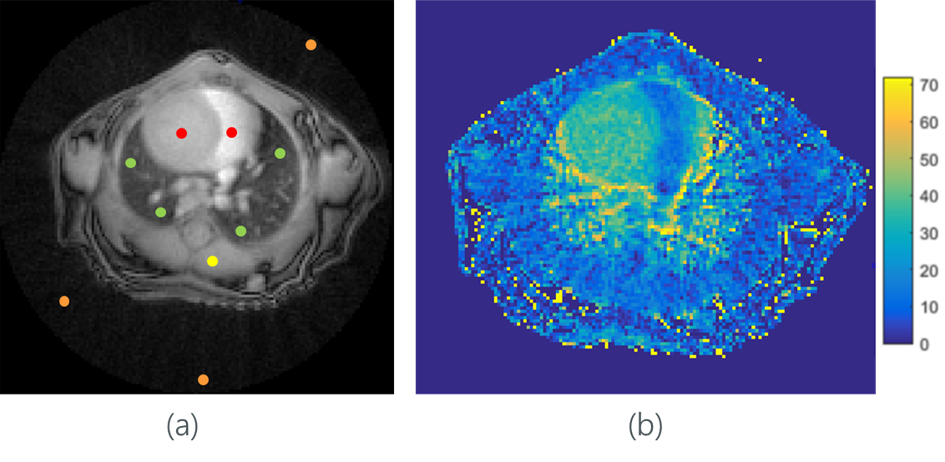
Figure 1: (a) Location of the different ROIs in the
heart (red), lung (green), muscle (yellow) and background (orange) superimposed
onto a pre CA image. In (b) the percentage change of signal intensity is shown.
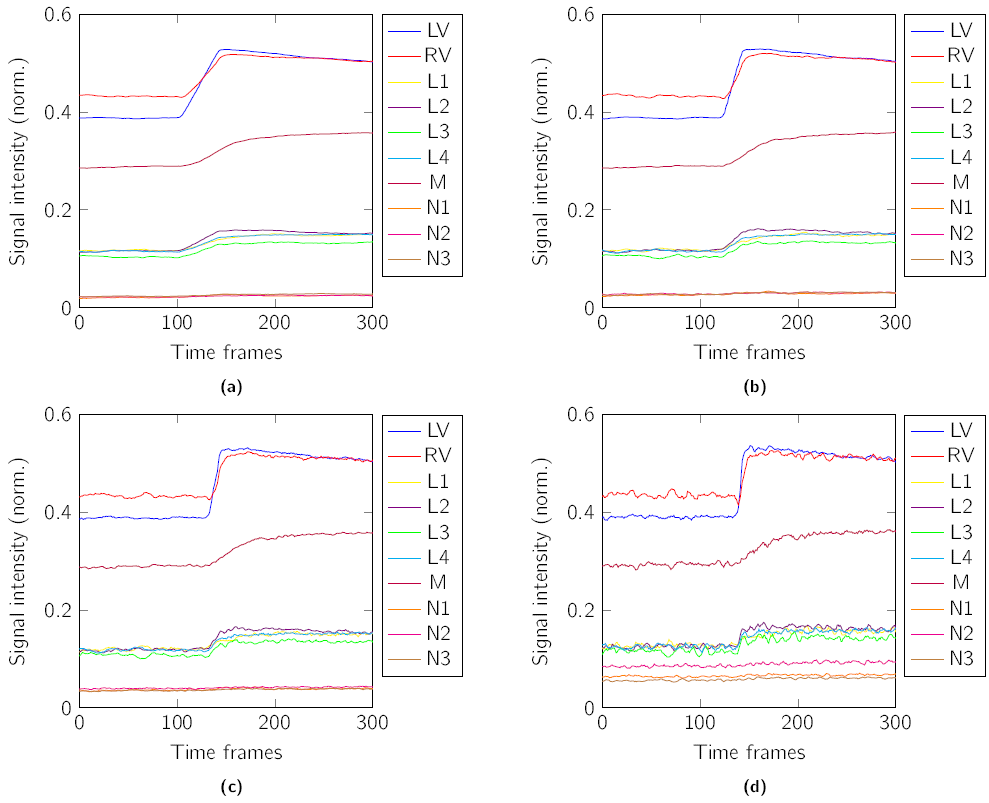
Figure 2: Signal intensity
changes during contrast agent injection. The time-frames in the graphs were
reconstructed with different sliding window width ((a) 1000 projections, (b)
500 projections, (c) 250 projections and (d) 100 projections, tW = 2.4s, 6s, 12s, 24s). The
sliding window step was chosen as 25 projections
(𝛥t = 600ms).