Anne-Christianne Kentgens1, Kathryn Ramsey1, Grzegorz Bauman2,3, Francesco Santini2,3, Christoph Corin Willers1, Philipp Latzin1, Oliver Bieri2,3, and Orso Pusterla2,3,4
1Division of Respiratory Medicine, Department of Pediatrics, Inselspital, University of Bern, Bern, Switzerland, 2Division of Radiological Physics, University Hospital Basel, Basel, Switzerland, 3Department of Biomedical Engineering, University Hospital Basel, Basel, Switzerland, 4Institute for Biomedical Engineering, University and ETH Zurich, Zurich, Switzerland
1Division of Respiratory Medicine, Department of Pediatrics, Inselspital, University of Bern, Bern, Switzerland, 2Division of Radiological Physics, University Hospital Basel, Basel, Switzerland, 3Department of Biomedical Engineering, University Hospital Basel, Basel, Switzerland, 4Institute for Biomedical Engineering, University and ETH Zurich, Zurich, Switzerland
Pulmonary
functional MRI with dynamic oxygen-enhanced relaxometry provide information on
lung ventilation and perfusion during the wash-in and washout of oxygen through
an MR-compatible Multiple Breath Washout lung function test.
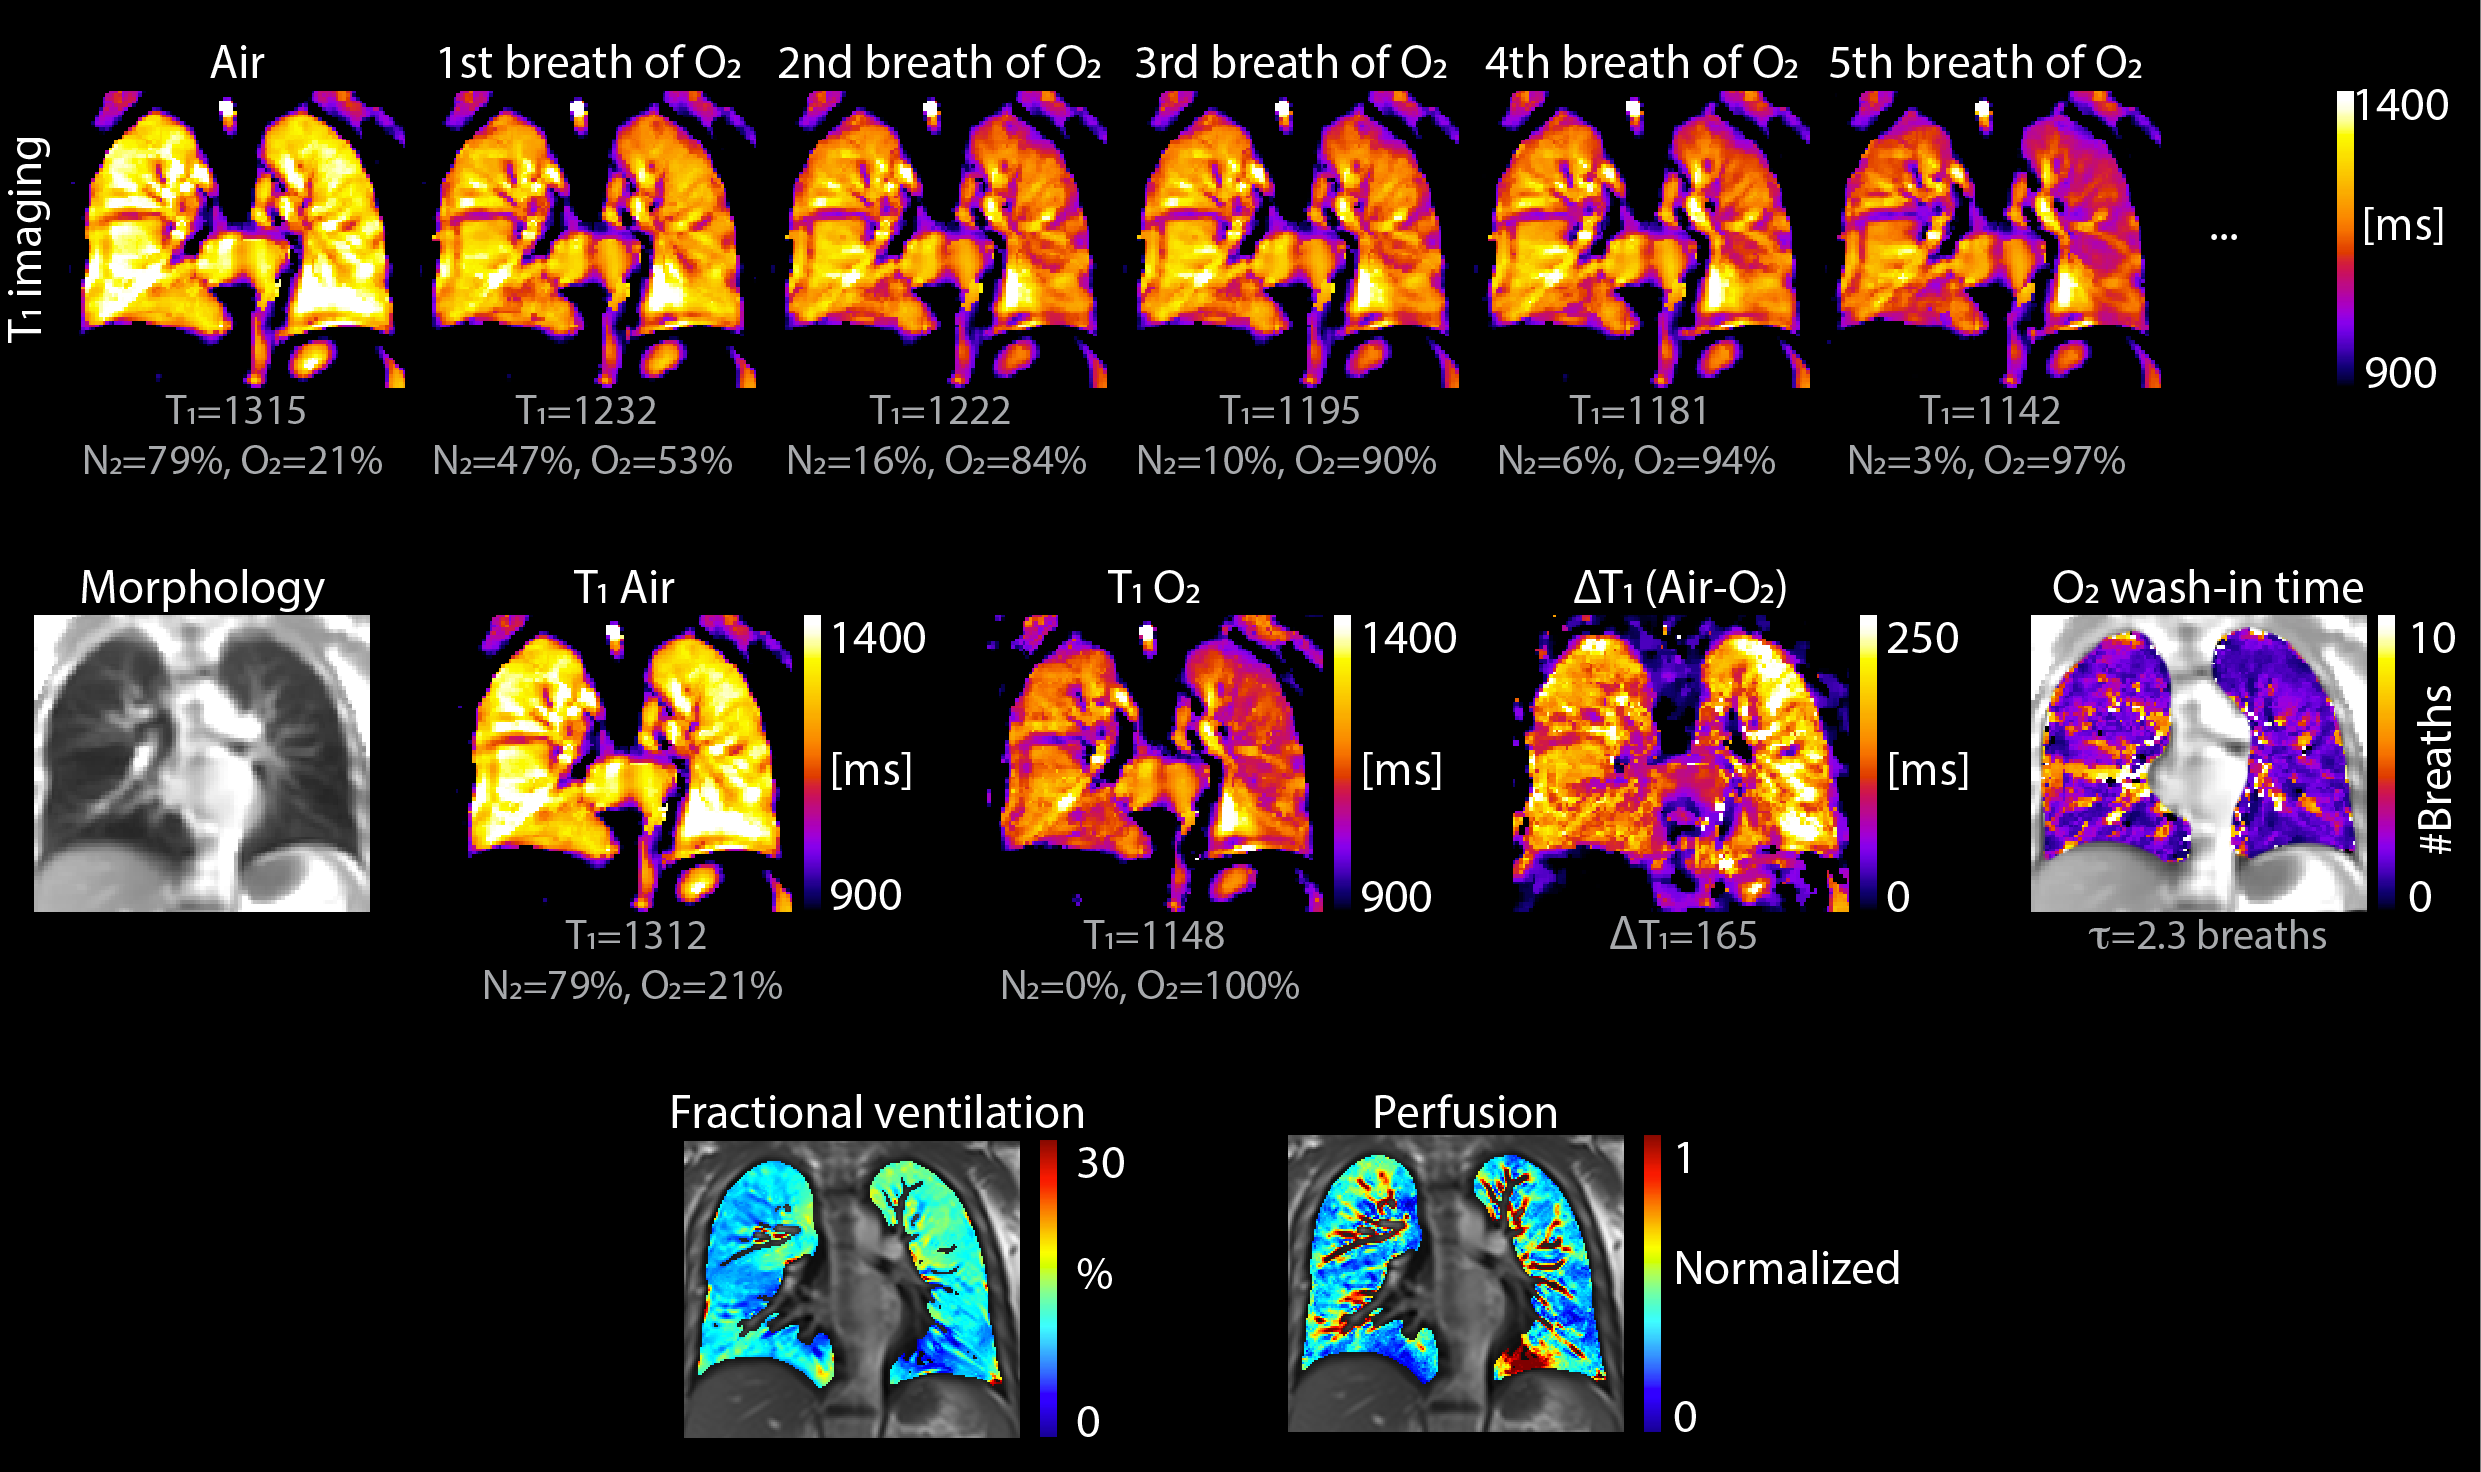
Figure
3. First row: T1 images acquired with
air and after a corresponding number of O2 wash-in breaths (N). Lung
mean T1 values and MR-measured gas concentrations are given. Second row shows
the following images respectively: morphological image, T1 during room air and O2
(full wash in) and oxygen enhanced and O2 wash-in time-constant
maps. Third row shows the images of ventilation and perfusion. This healthy
volunteer has slightly increased ventilation in the left upper lung as compared
to right. Similarly, the OE signal is higher in the upper left lung, and the
wash-in shorter.
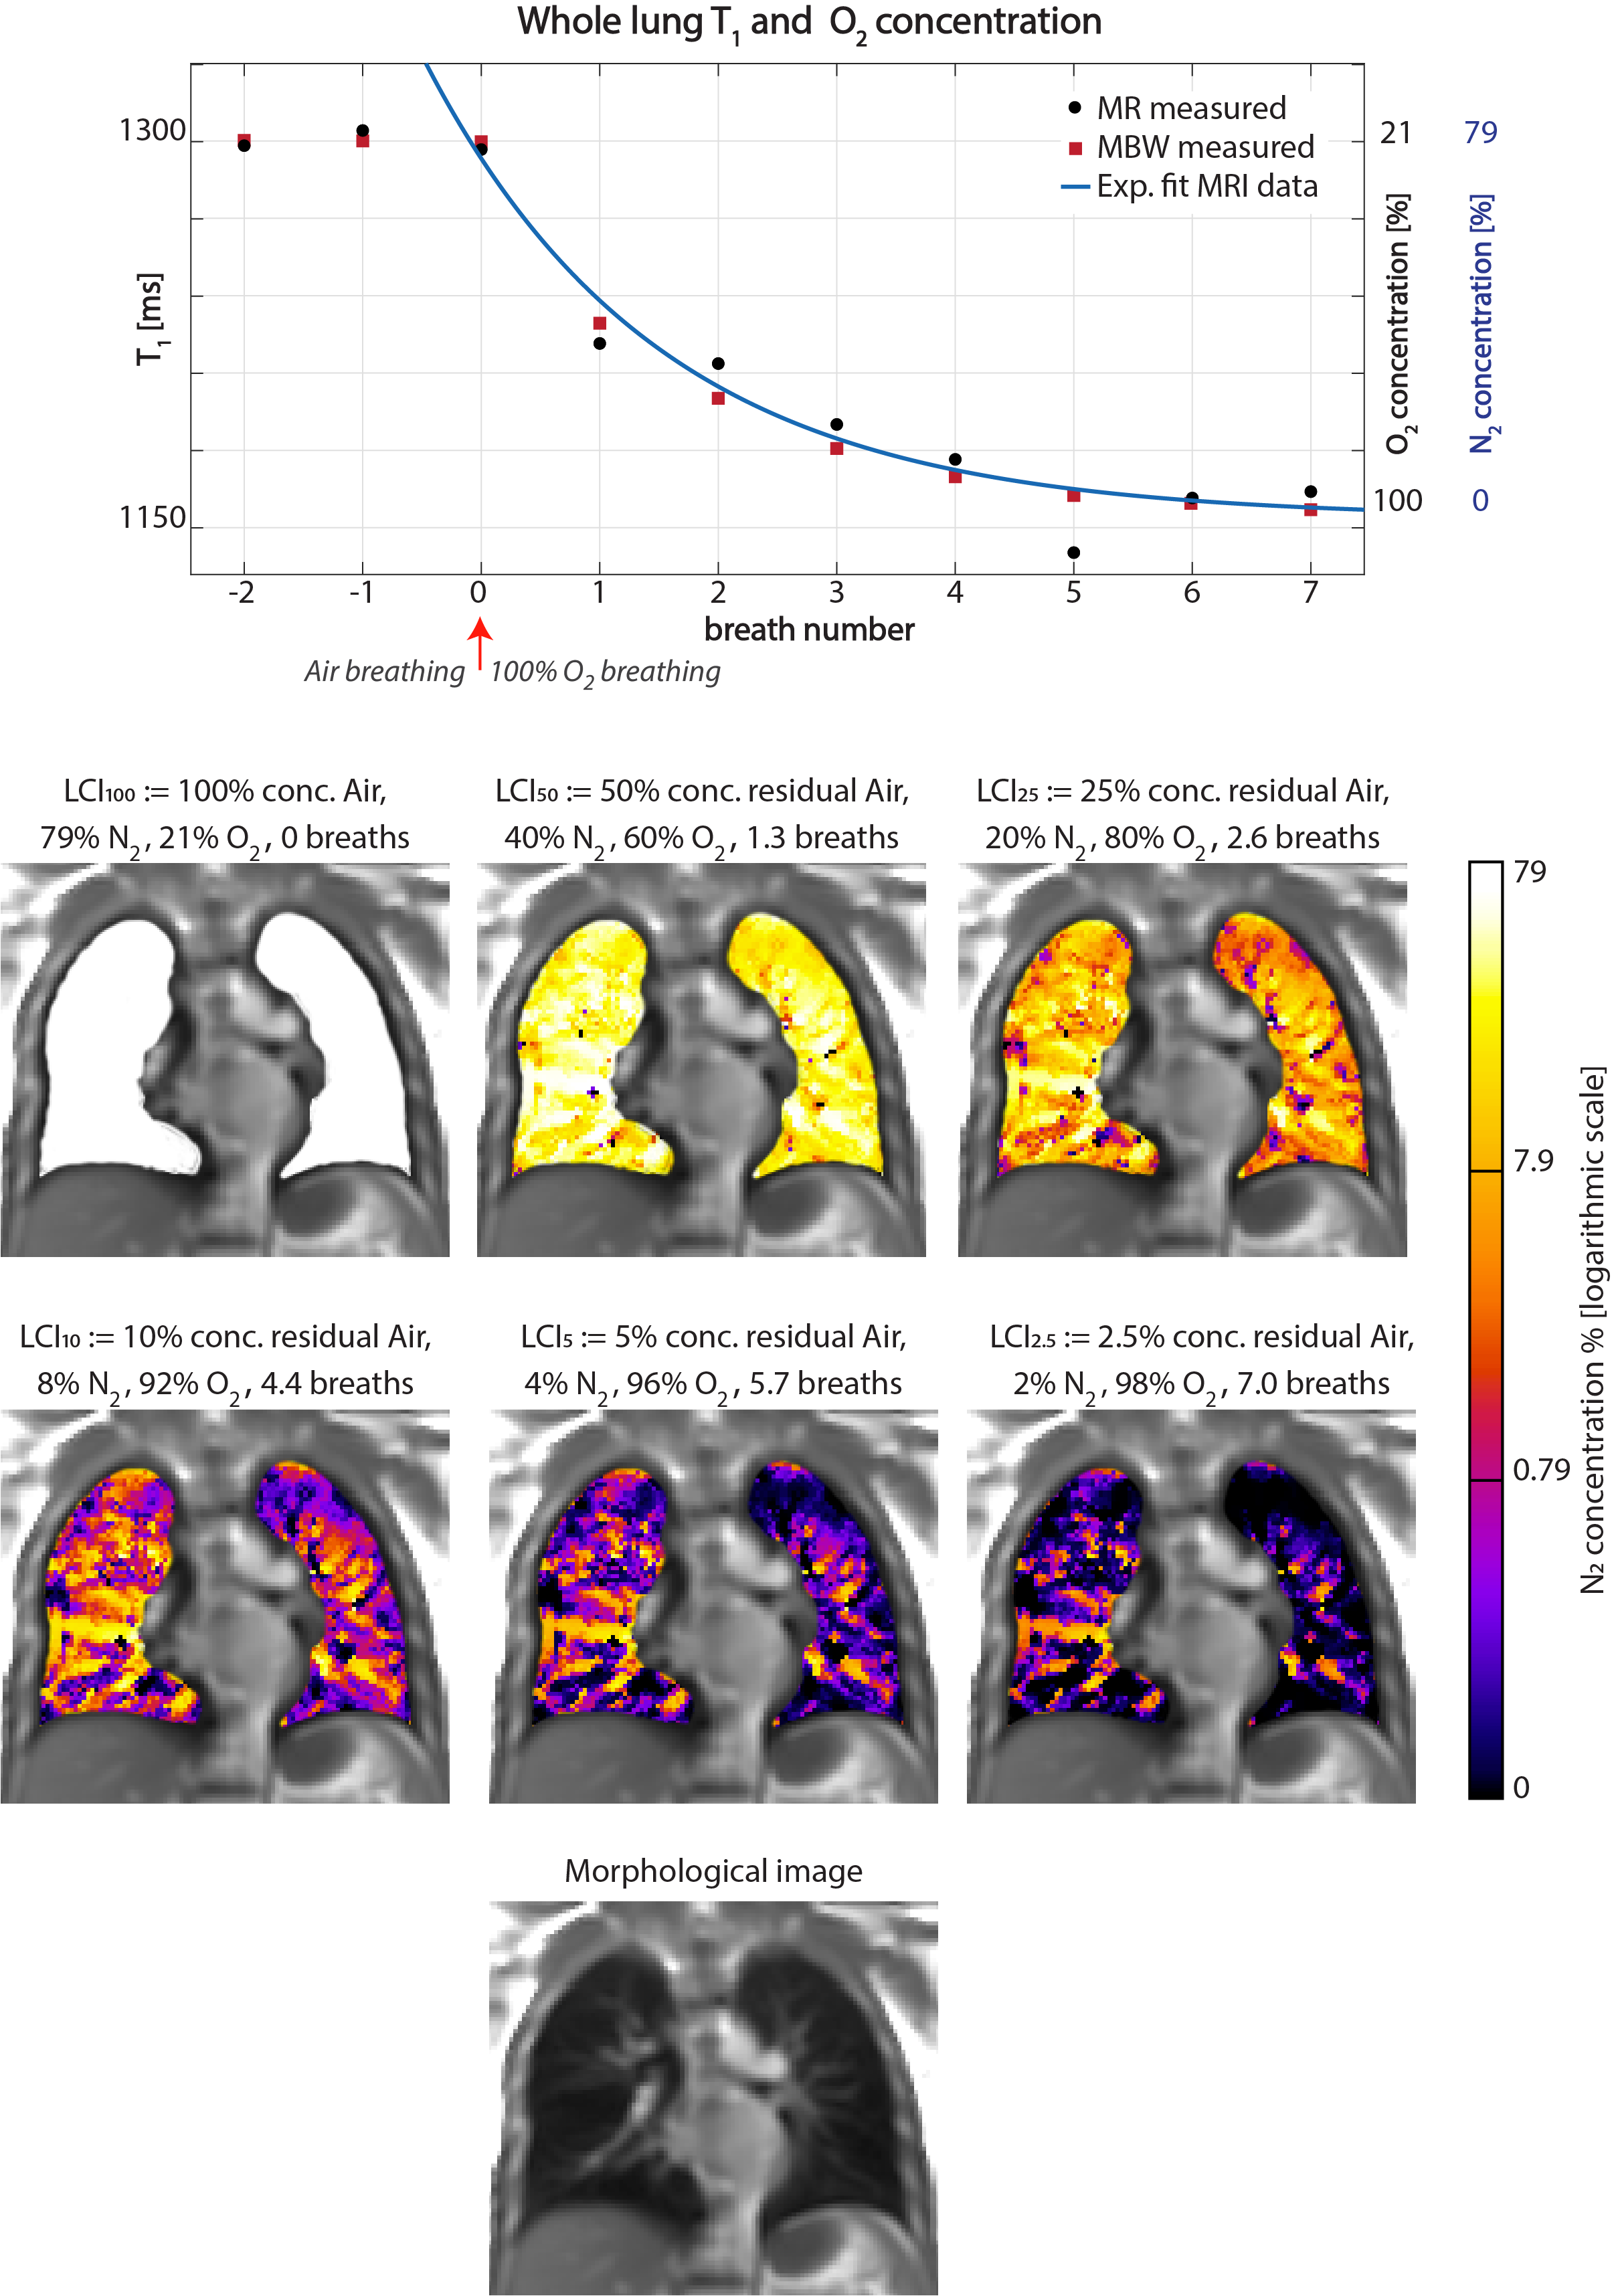
Figure
4. On the top: graph showing the pulmonary mean T1 and gas concentrations
throughout the first seven N2 washout / O2 wash-in
breaths. O2 delivery starts at breath number 0. To note the close
relationship with MBW measured gas concentration of the exemplary MBW curve (cf.
Figure 1); e.g. the O2 concentration at the third breath as measured
with the MRI is 80%, whereas with MBW it is ~77%. In the middle: maps of
residual regional N2 gas concentration after the corresponding
number of oxygen wash-in breaths (N). On the bottom: morphological image to
locate lung vessels and structures.
