Mauro Costagli1,2, Graziella Donatelli3,4, Paolo Cecchi3,4, Gabriele Siciliano4,5, and Mirco Cosottini3,4,5
1University of Genova, Genova, Italy, 2IRCCS Stella Maris, Pisa, Italy, 3IMAGO 7 Research Foundation, Pisa, Italy, 4Azienda Ospedaliero Universitaria Pisana, Pisa, Italy, 5University of Pisa, Pisa, Italy
1University of Genova, Genova, Italy, 2IRCCS Stella Maris, Pisa, Italy, 3IMAGO 7 Research Foundation, Pisa, Italy, 4Azienda Ospedaliero Universitaria Pisana, Pisa, Italy, 5University of Pisa, Pisa, Italy
The joint use of different distribution indices of M1 QSM values
in a Support Vector Machine enables to discriminate between patients with ALS
and controls with high diagnostic accuracy.
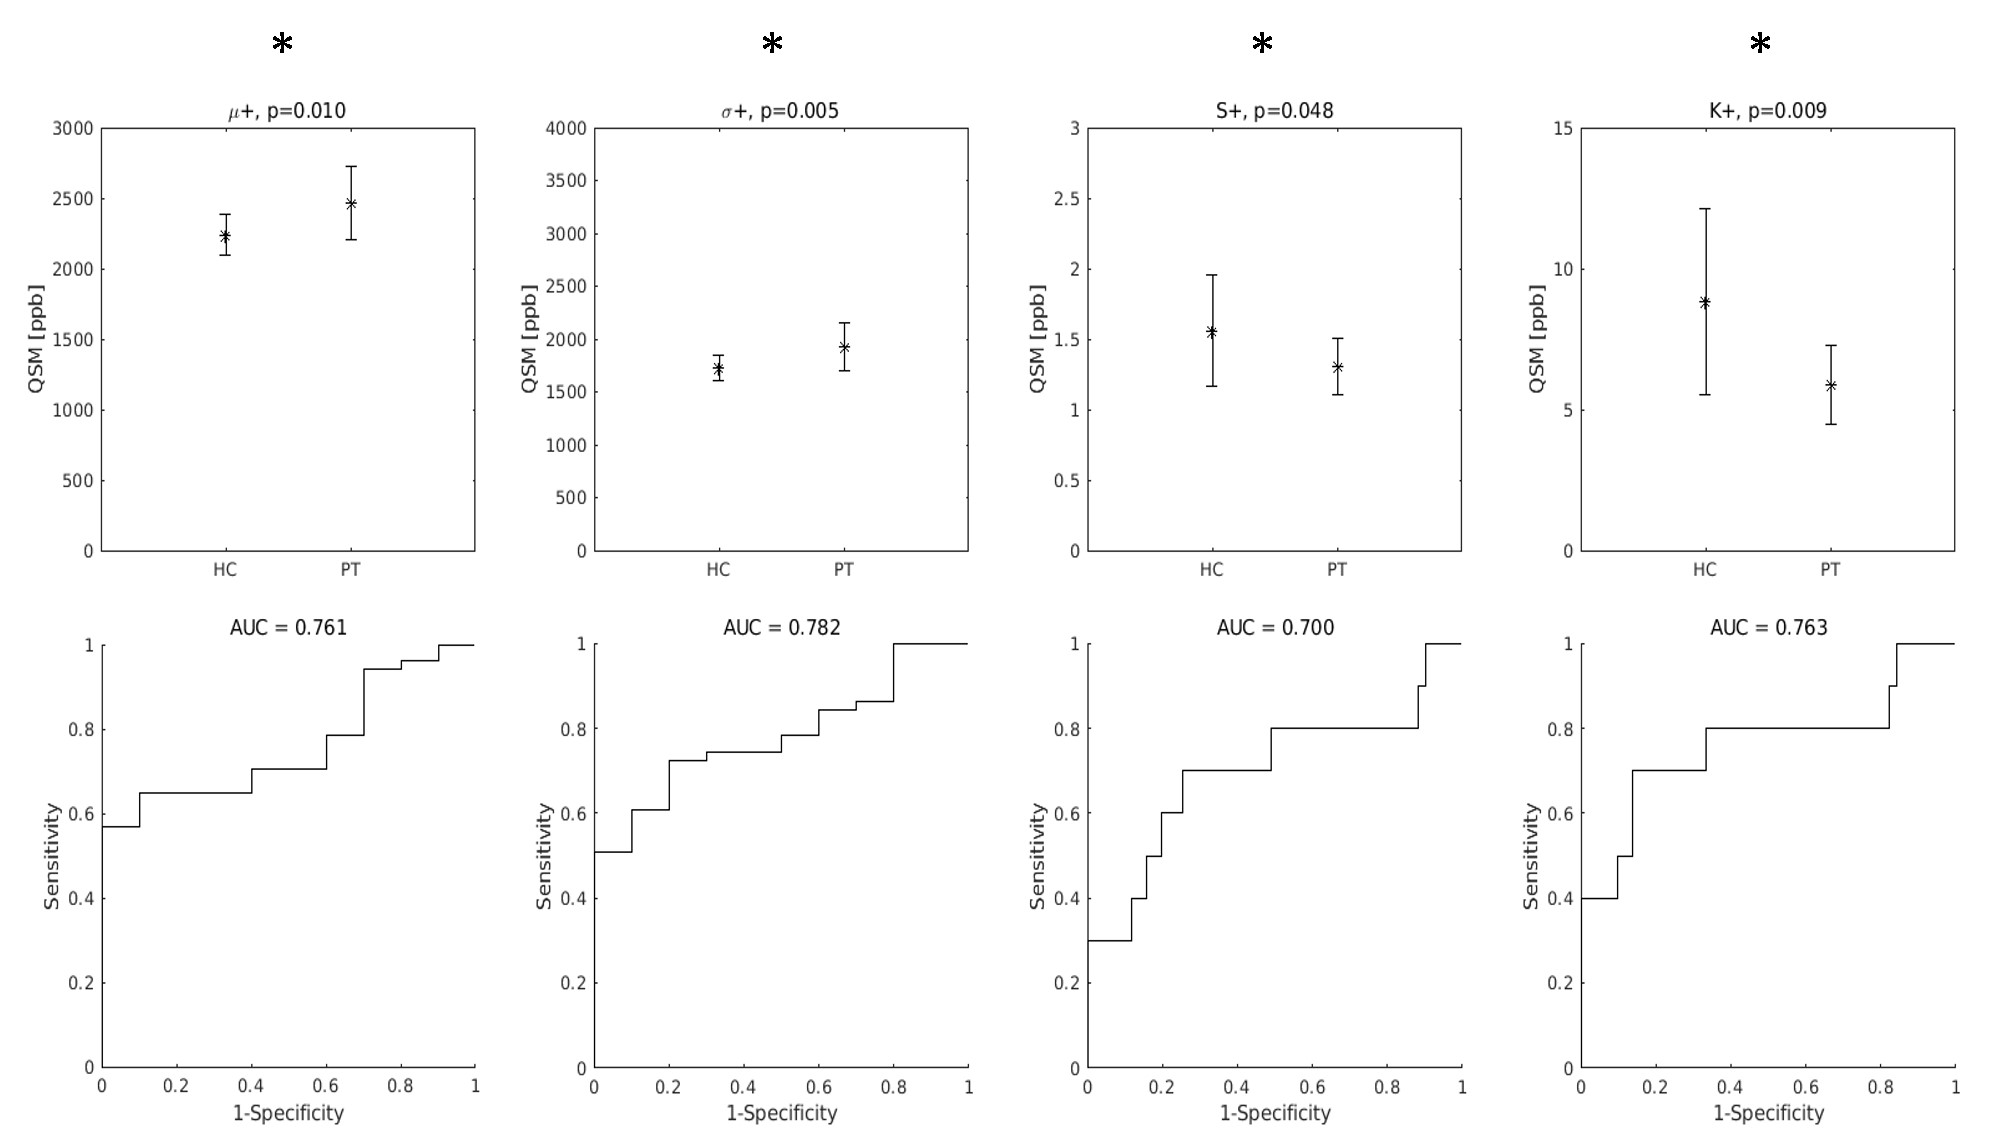
Top row: group differences in the distribution indices of M1 QSM positive values. Asterisks indicate that all differences were statistically significant. Bottom row: diagnostic accuracy of each feature.
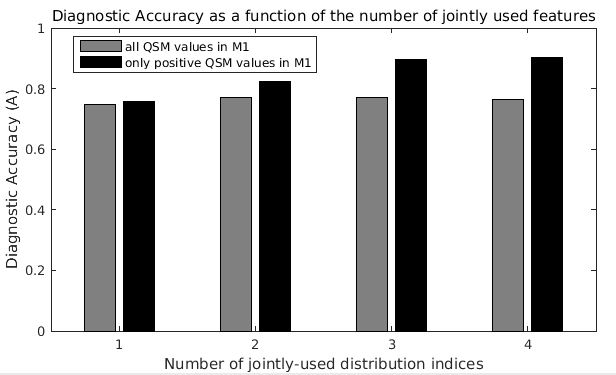
Maximum diagnostic accuracy of SVM classifiers as a function of the number of QSM distibution indices jointly considered. For example, the last black bar on the right indicates the maximum diagnostic accuracy (A = 0.90) obtained with the joint use of all four distribution indices of QSM positive values in M1.