Takashi Fujiwara1, Haben Berhane2,3, Michael Baran Scott3, Zachary King2, Michal Schafer4, Brian Fonseca4, Joshua Robinson3, Cynthia Rigsby2,3, Lorna Browne4, Michael Markl3, and Alex Barker1,5
1Department of Radiology, Children's Hospital Colorado, University of Colorado Anschutz Medical Campus, Aurora, CO, United States, 2Lurie Children's Hospital of Chicago, Chicago, IL, United States, 3Northwestern University, Evanston, IL, United States, 4Children's Hospital Colorado, University of Colorado Anschutz Medical Campus, Aurora, CO, United States, 5Department of Bioengineering, University of Colorado Anschutz Medical Campus, Aurora, CO, United States
1Department of Radiology, Children's Hospital Colorado, University of Colorado Anschutz Medical Campus, Aurora, CO, United States, 2Lurie Children's Hospital of Chicago, Chicago, IL, United States, 3Northwestern University, Evanston, IL, United States, 4Children's Hospital Colorado, University of Colorado Anschutz Medical Campus, Aurora, CO, United States, 5Department of Bioengineering, University of Colorado Anschutz Medical Campus, Aurora, CO, United States
We
found multi-site, multi-vender 4D flow MRI datasets improved performance in cases with
challenging anatomy in
segmenting large arteries, improving flow quantification of difficult cases as
well as overall performance.
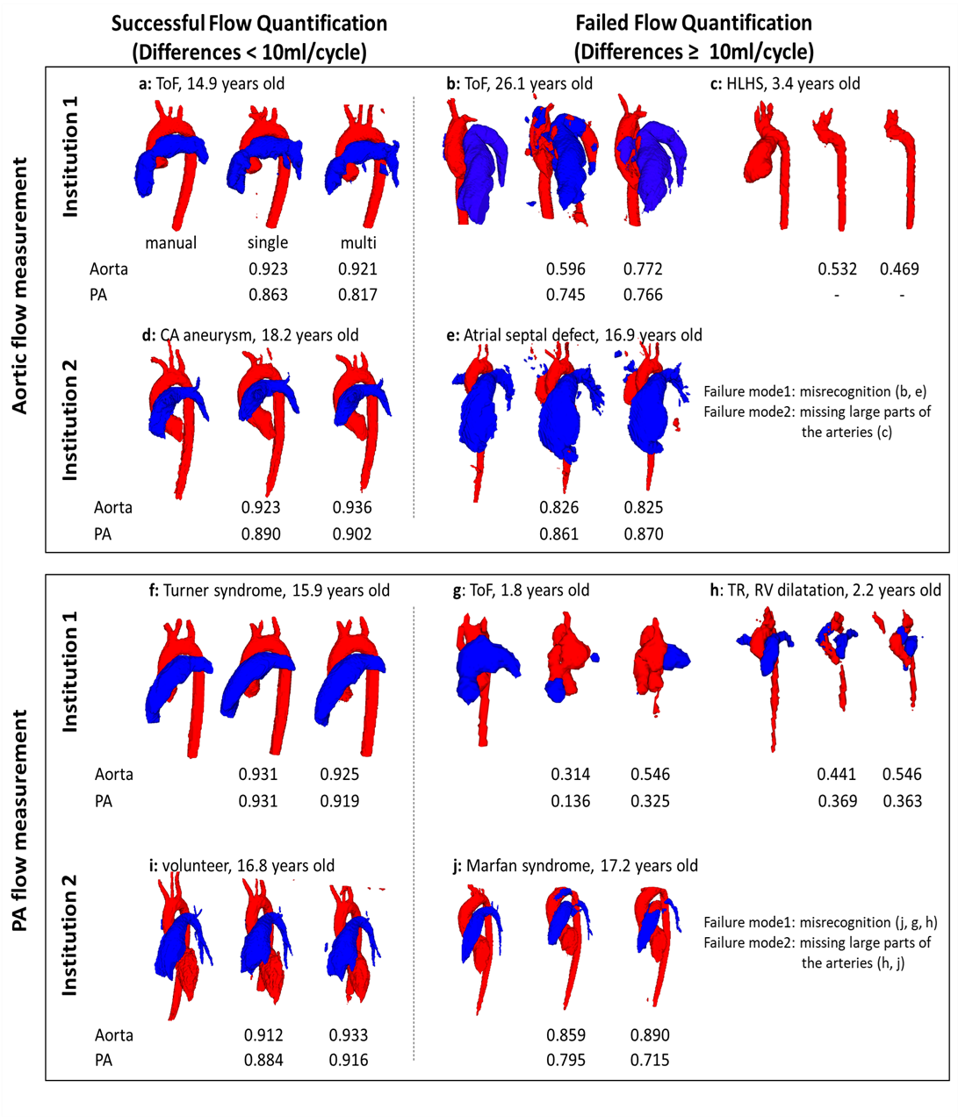
Fig. 3 Some examples of successful/failed
(differences ≥ 10ml/cycle) hemodynamic
measurements in multi-site training. Segmentations of aorta (red) and pulmonary
arteries (PA, blue) from both single-site and multi-site CNN are presented with
Dice scores. The letters correspond to those in Fig. 2. ToF, tetralogy of Fallot; TR,
tricuspid regurgitation; HLHS, hypoplastic left heart syndrome.
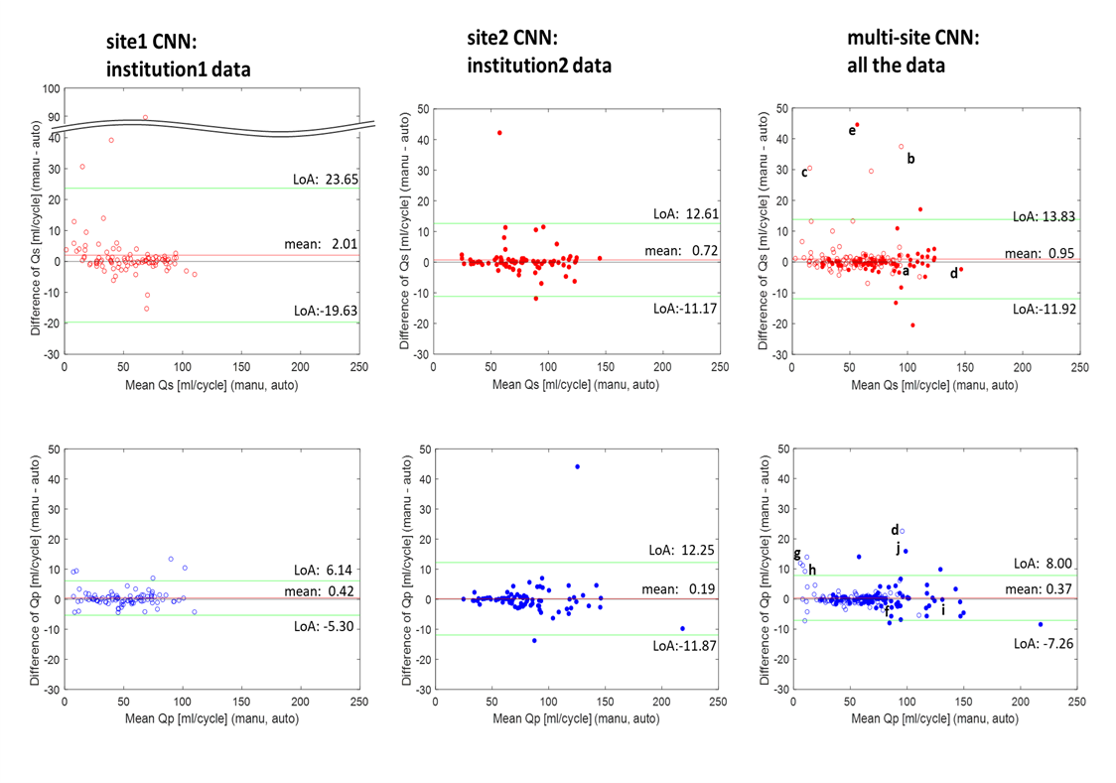
Fig. 2
Bland-Altman plots for net flow in the ascending aorta (Qs, upper row) and main pulmonary trunk (Qp, lower row) quantified by site1 CNN,
site2 CNN, and multi-site CNN. Institution1 data are plotted by open circles
while institution2 data are shown by solid circles. Limits of agreement and
mean differences are presented as green and red lines. The letter labels indicate
successful and failed (differences ≥ 10ml/cycle) examples for flow
quantification. The labels correspond to the segmentations shown in Fig. 3.