Wanyong Shin1, Balu Krishnan2, Ajay Nemani1, Anna Crawford1, and Mark J Lowe1
1Radiology, Cleveland Clinic, Cleveland, OH, United States, 2Epilepsy, Cleveland Clinic, Cleveland, OH, United States
1Radiology, Cleveland Clinic, Cleveland, OH, United States, 2Epilepsy, Cleveland Clinic, Cleveland, OH, United States
In this study, we compare low-frequency fluctuation of theta to beta ratio (TBR) in the resting-state motor network with calibrated fMRI. The temporal fluctuation of TBR could be a potential index to investigate the resting-state brain networks in simultaneous EEG-fMRI studies.
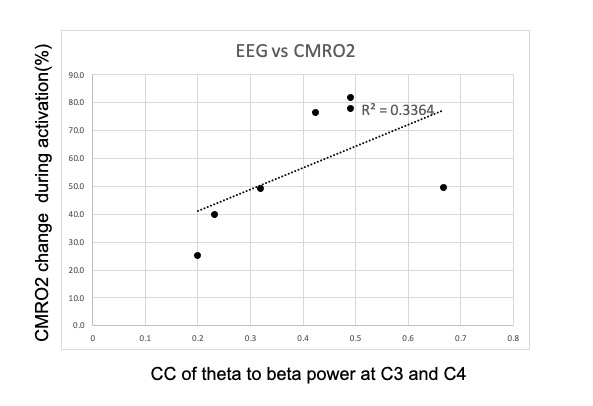
Fig 4. X and Y axes represent Pearson correlation coefficient of theta to beta fluctuation between C3 and C4 in the resting state, and estimated CMRO2 values in activated left M1 ROI.
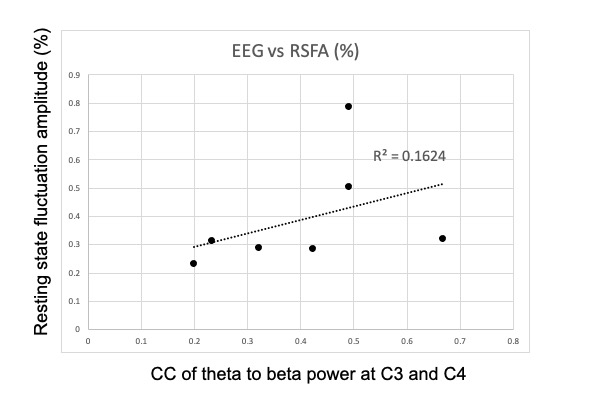
Fig 5. X and Y axes represent Pearson correlation coefficient of theta to beta fluctuation between C3 and C4 in the resting state, and percentage resting state fluctuation amplitude (RSFA) in activated left M1 ROI.