Thomas Lindner1, Michael Helle2, Olav Jansen3, and Stephan Ulmer3,4
1University Hospital Hamburg-Eppendorf, Hamburg, Germany, 2Tomographic Imaging Department, Philips Research Laboratories, Hamburg, Germany, 3Department of Radiology and Neuroradiology, University Hospital Schleswig-Holstein, Kiel, Germany, 4Radiology, Kantonsspital Winterthur, Winterthur, Switzerland
1University Hospital Hamburg-Eppendorf, Hamburg, Germany, 2Tomographic Imaging Department, Philips Research Laboratories, Hamburg, Germany, 3Department of Radiology and Neuroradiology, University Hospital Schleswig-Holstein, Kiel, Germany, 4Radiology, Kantonsspital Winterthur, Winterthur, Switzerland
In this study, the effects of separating the label and control
condtion from an Arterial Spin Labeling dataset used for resting state
mapping was investigated and no differences between the label and the
control condition could be found.
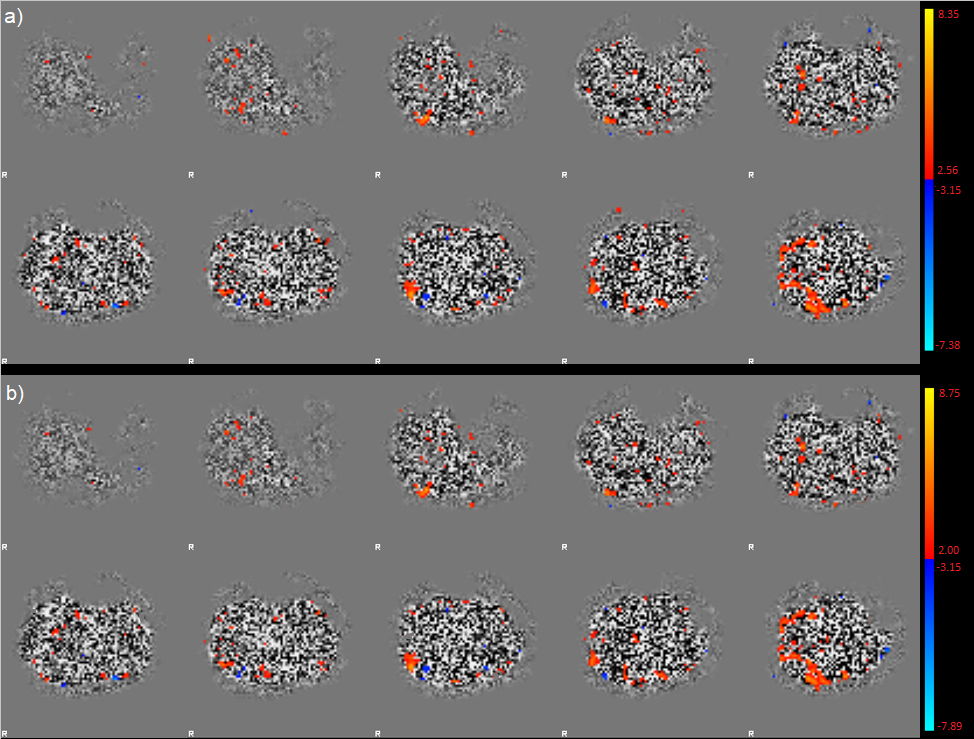
Figure 1: Example of one
dataset in which the control (a) and the label (b) images were post-processed
individually. There are only subtle differences visible and small deviations in
signal strength showing that there are no differences to be expected in
interpreting the data.
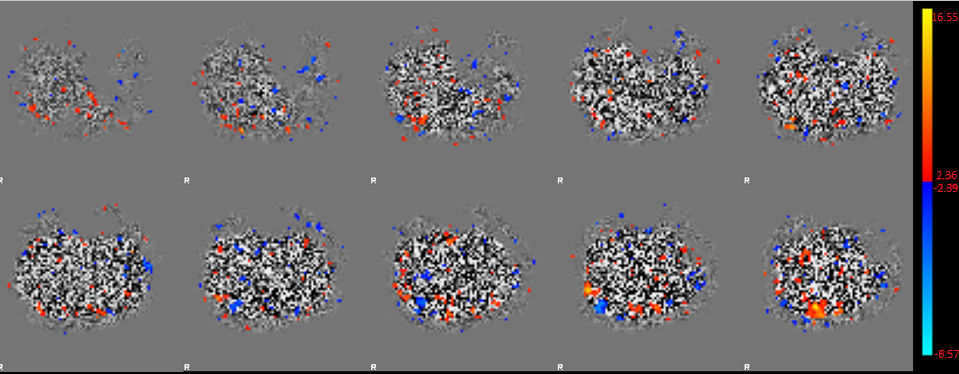
Figure 2: Same dataset as used
in figure 1, but this time both label and control images have been used for
processing, i.e. 80 datapoints (40 pairs) per slice were used. The patterns are
similar yet appear better delineated showing the higher statistical power of
this approach. Interestingly, the patter in the bottom middle image is not
visible in this result, suggesting that it is a false-positive activation in
the datasets with less datapoints.