Linqing Li1, Sean Marrett1, Andy John Derbyshire1, and Peter Bandettini 2
1Functional MRI Facility/NIMH, National Institutes of Health, Bethesda, MD, United States, 2National Institute of Mental Health, National Institutes of Health, Bethesda, MD, United States
1Functional MRI Facility/NIMH, National Institutes of Health, Bethesda, MD, United States, 2National Institute of Mental Health, National Institutes of Health, Bethesda, MD, United States
We derived a simple coupling relationship for changes of CMRO2 calculation as (CMRO2/CMRO20)=(CBF/CBF0)0.25 when α=0.38, β=1.5. It is suggested that percentage changes of CMRO2, δ(CMRO2), can be directly calculated from changes of CBF without prior knowledge of M.
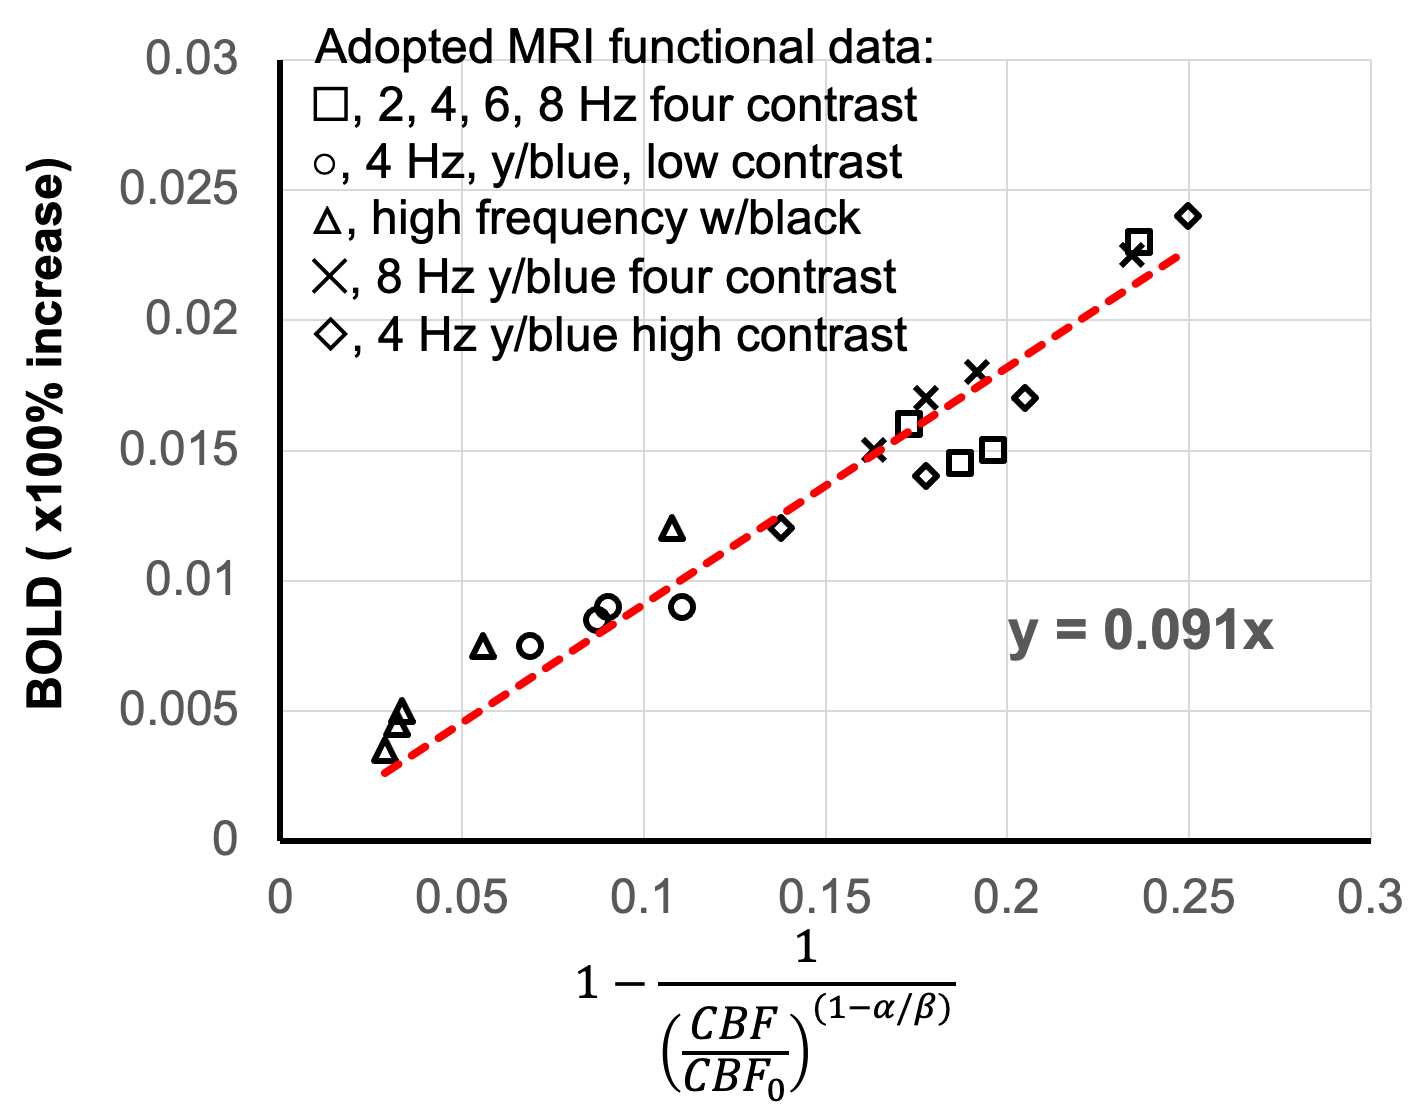
Figure. 3 Fitting results for M parameter determination based on graded visual stimulation data adapted from Fig. 7a of Hoge, et al., MRM, 1999. Data were acquired with 2, 4, 6 and 8 Hz stimulation under different contrast and colors. Based on our Eq. 5, linear fitting result of M was determined to be 0.09, which is approximately in line with M parameter in Davis work shown in Figure. 2. Note, this M=0.09 is significantly different from M=0.22 from its CO2 calibration approach, potentially due to instability of CO2 approach.
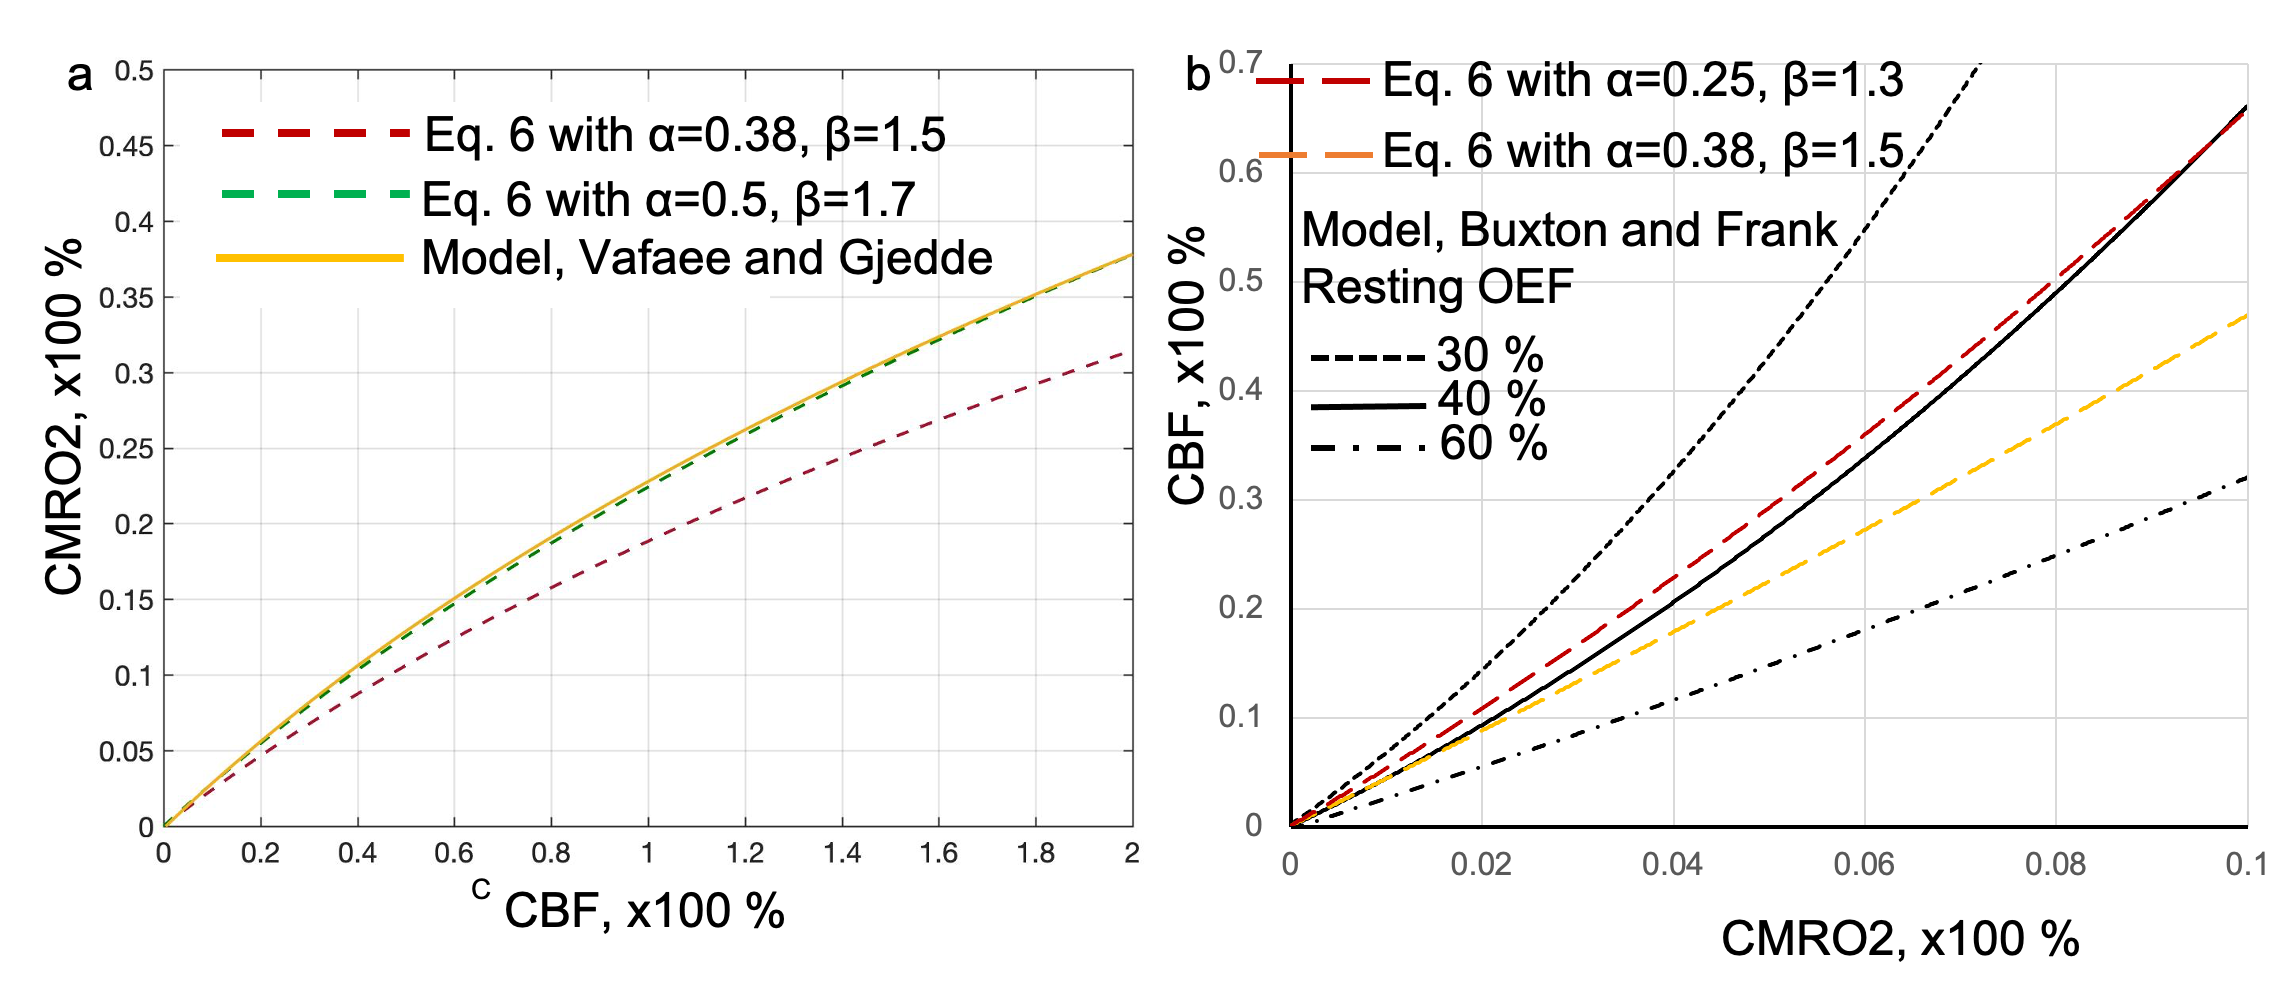
Figure. 4 Comparisons of Eq. 6 with oxygen delivery models. Fig. 4a, In model from Vafaee and Gjedde, curve green line was calculated with parameters of Ca, arterial oxygen concentration 7.8 mmoI/L, L the average oxygen diffusion capacity 4.09 μmol/hg-1min-1 per mm Hg-1), P50=26 mmHg and h, Hill coefficient of the oxygen dissociation curve, 2.84. Fig. 4b, in model from Buxton and Frank, three resting OEF values were simulated as 30%, 40% and 60% as the model is sensitive to the resting OEF. Eq. 6 curves red and yellow dash lines were calculated from different α and β values.