Mario Gilberto Baez-Yanez1, Alex Bhogal1, Wouter Schellekens1, Jeroen C.W. Siero1,2, and Natalia Petridou1
1Department of Radiology, Center for Image Sciences, University Medical Center Utrecht, Utrecht, Netherlands, 2Spinoza Centre for Neuroimaging Amsterdam, Amsterdam, Netherlands
1Department of Radiology, Center for Image Sciences, University Medical Center Utrecht, Utrecht, Netherlands, 2Spinoza Centre for Neuroimaging Amsterdam, Amsterdam, Netherlands
Gas challenges during BOLD-fMRI is appealing to study hemodynamic changes. With the support of computational
modeling, gas manipulations provide a means to infer vascular contributions. We
show look-up tables of the possible vascular contribution
responsible for measured BOLD signals
Look-up
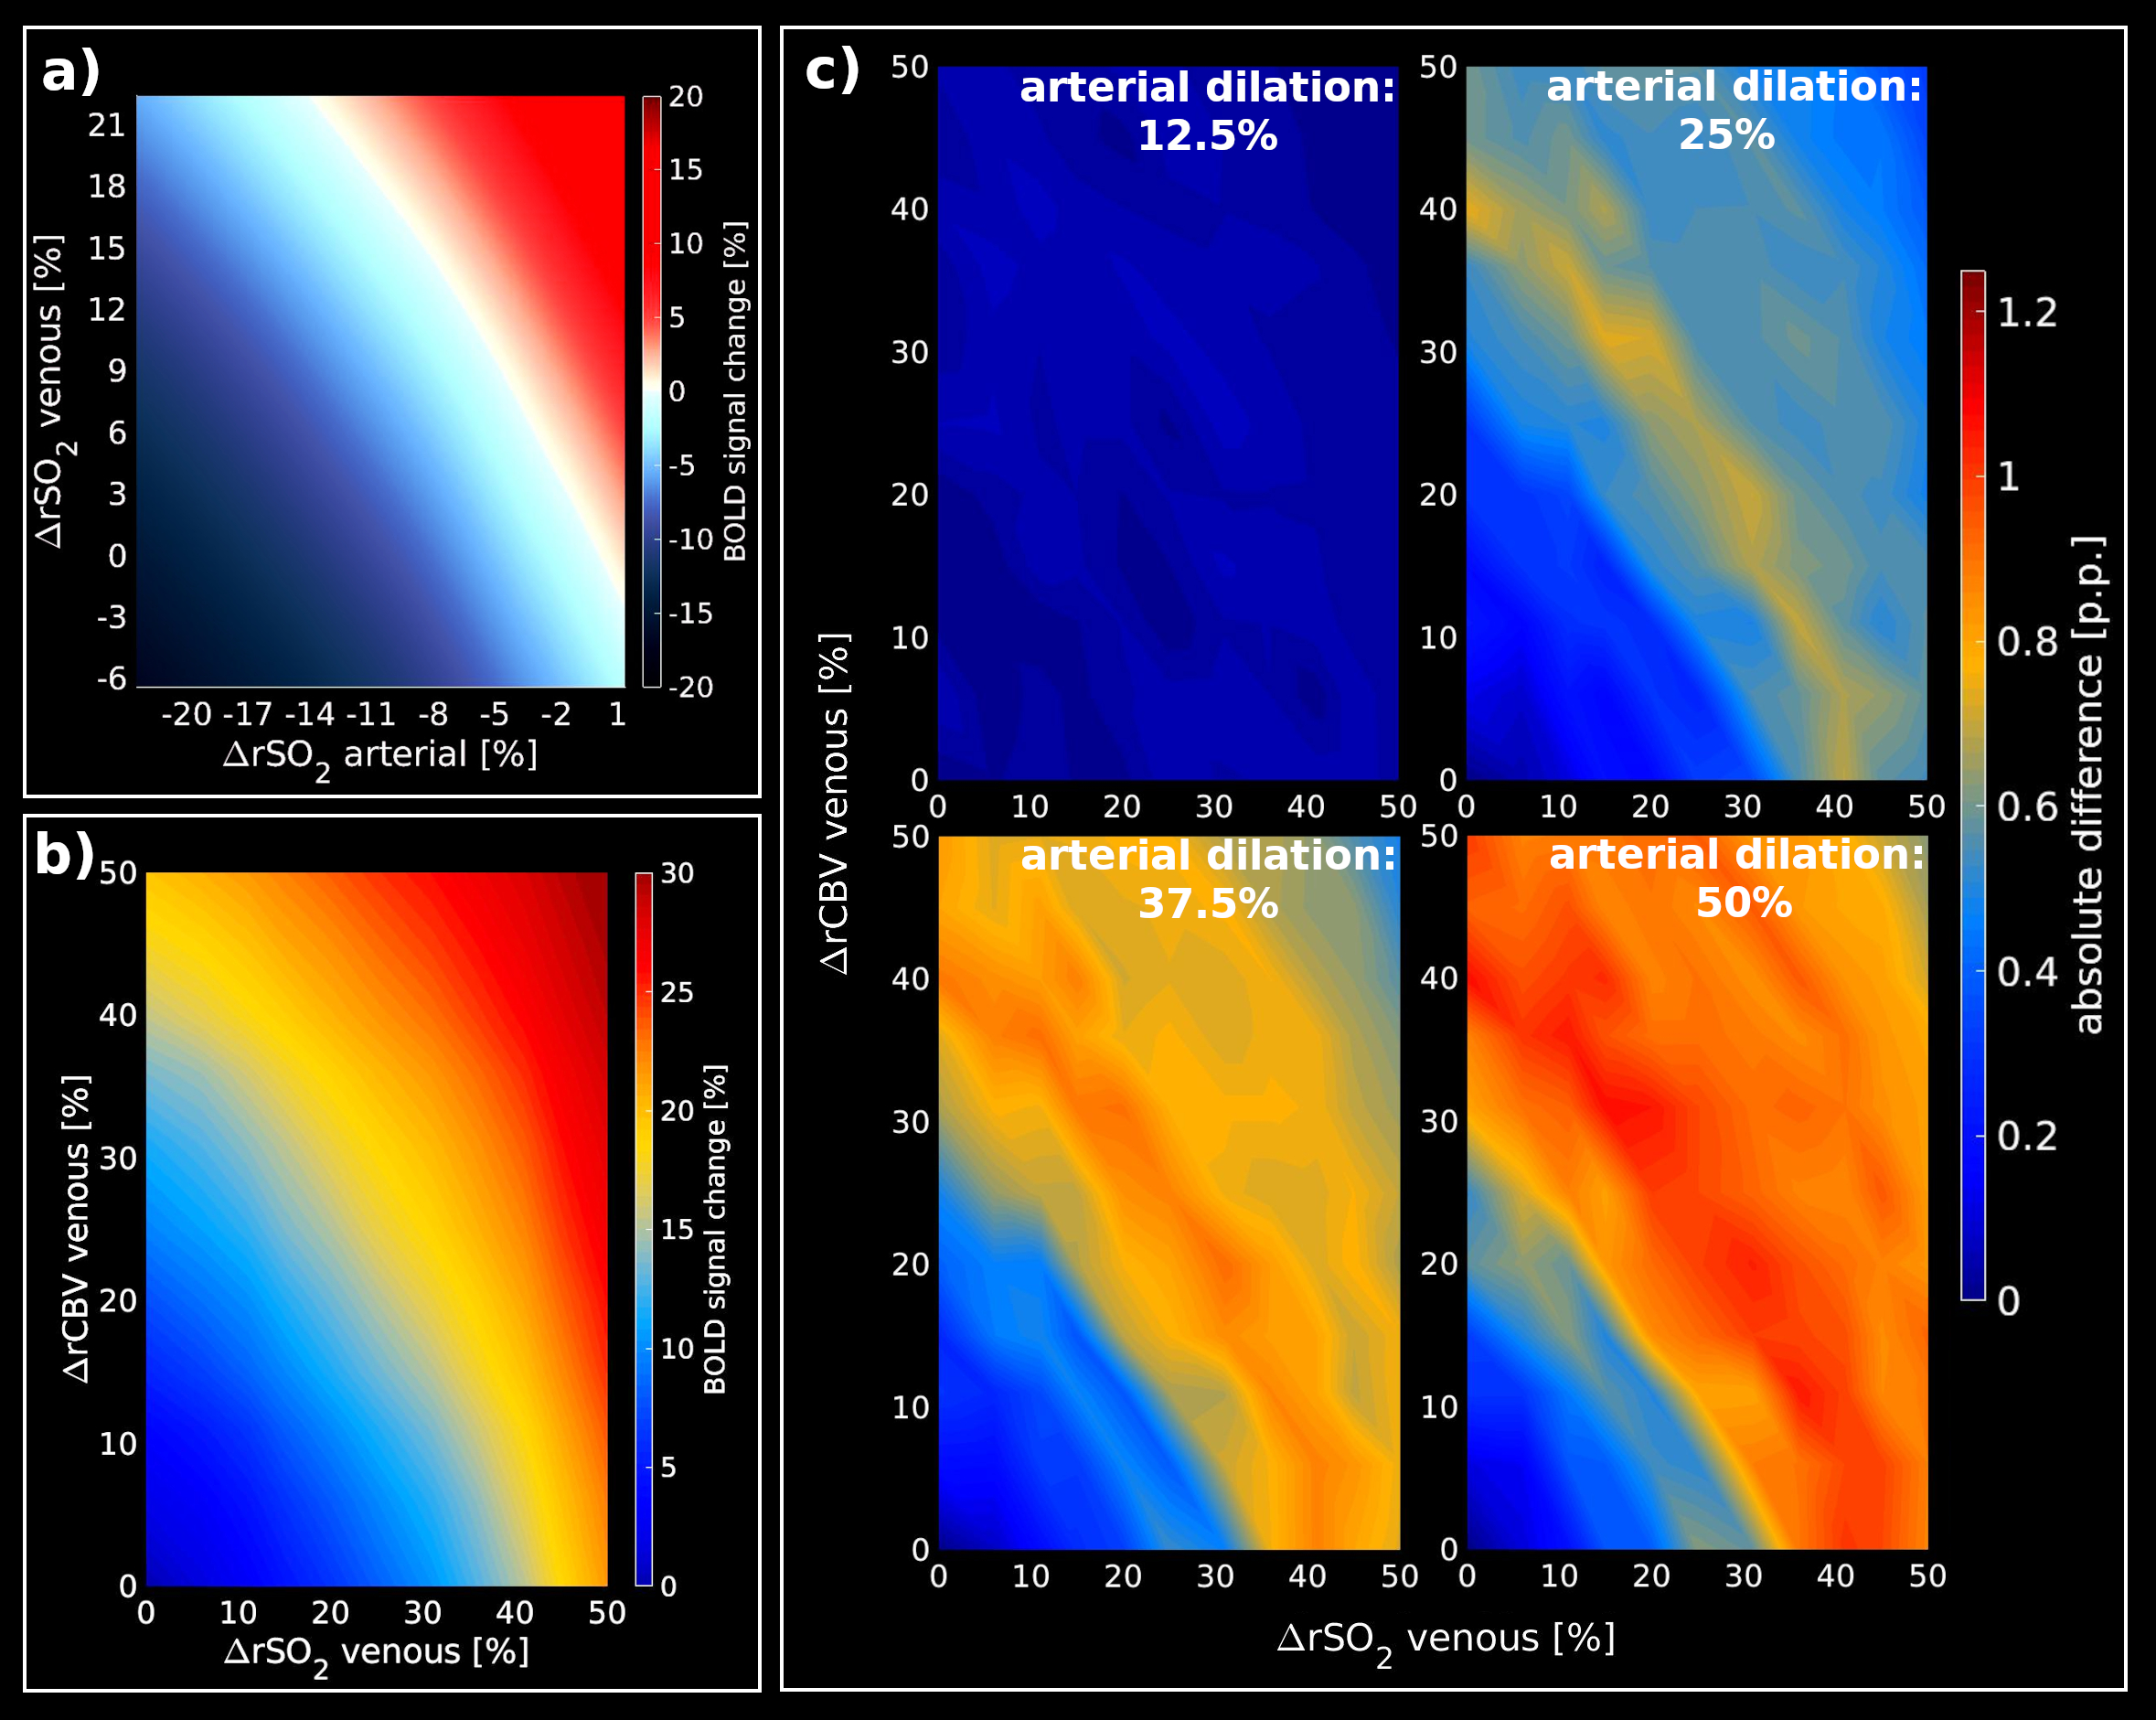
tables obtained from a representative RVN model. (a)
shows the relative BOLD-fMRI signal change assuming SO2
changes for arteries and veins, separately, while CBV is kept constant (arterial basal SO2=98%;
venous basal SO2=60%).
(b) Look-up table for different SO2/CBV
changes in the venous compartment assuming an arterial basal-state
(arterial SO2=98%,
arterial dilation=0%). (c) show the absolute difference between the
basal-state (b) and different percentages of arterial dilation states
(12.5%, 25%, 37.5%, 50%) while the arterial SO2
is constant at 98%.
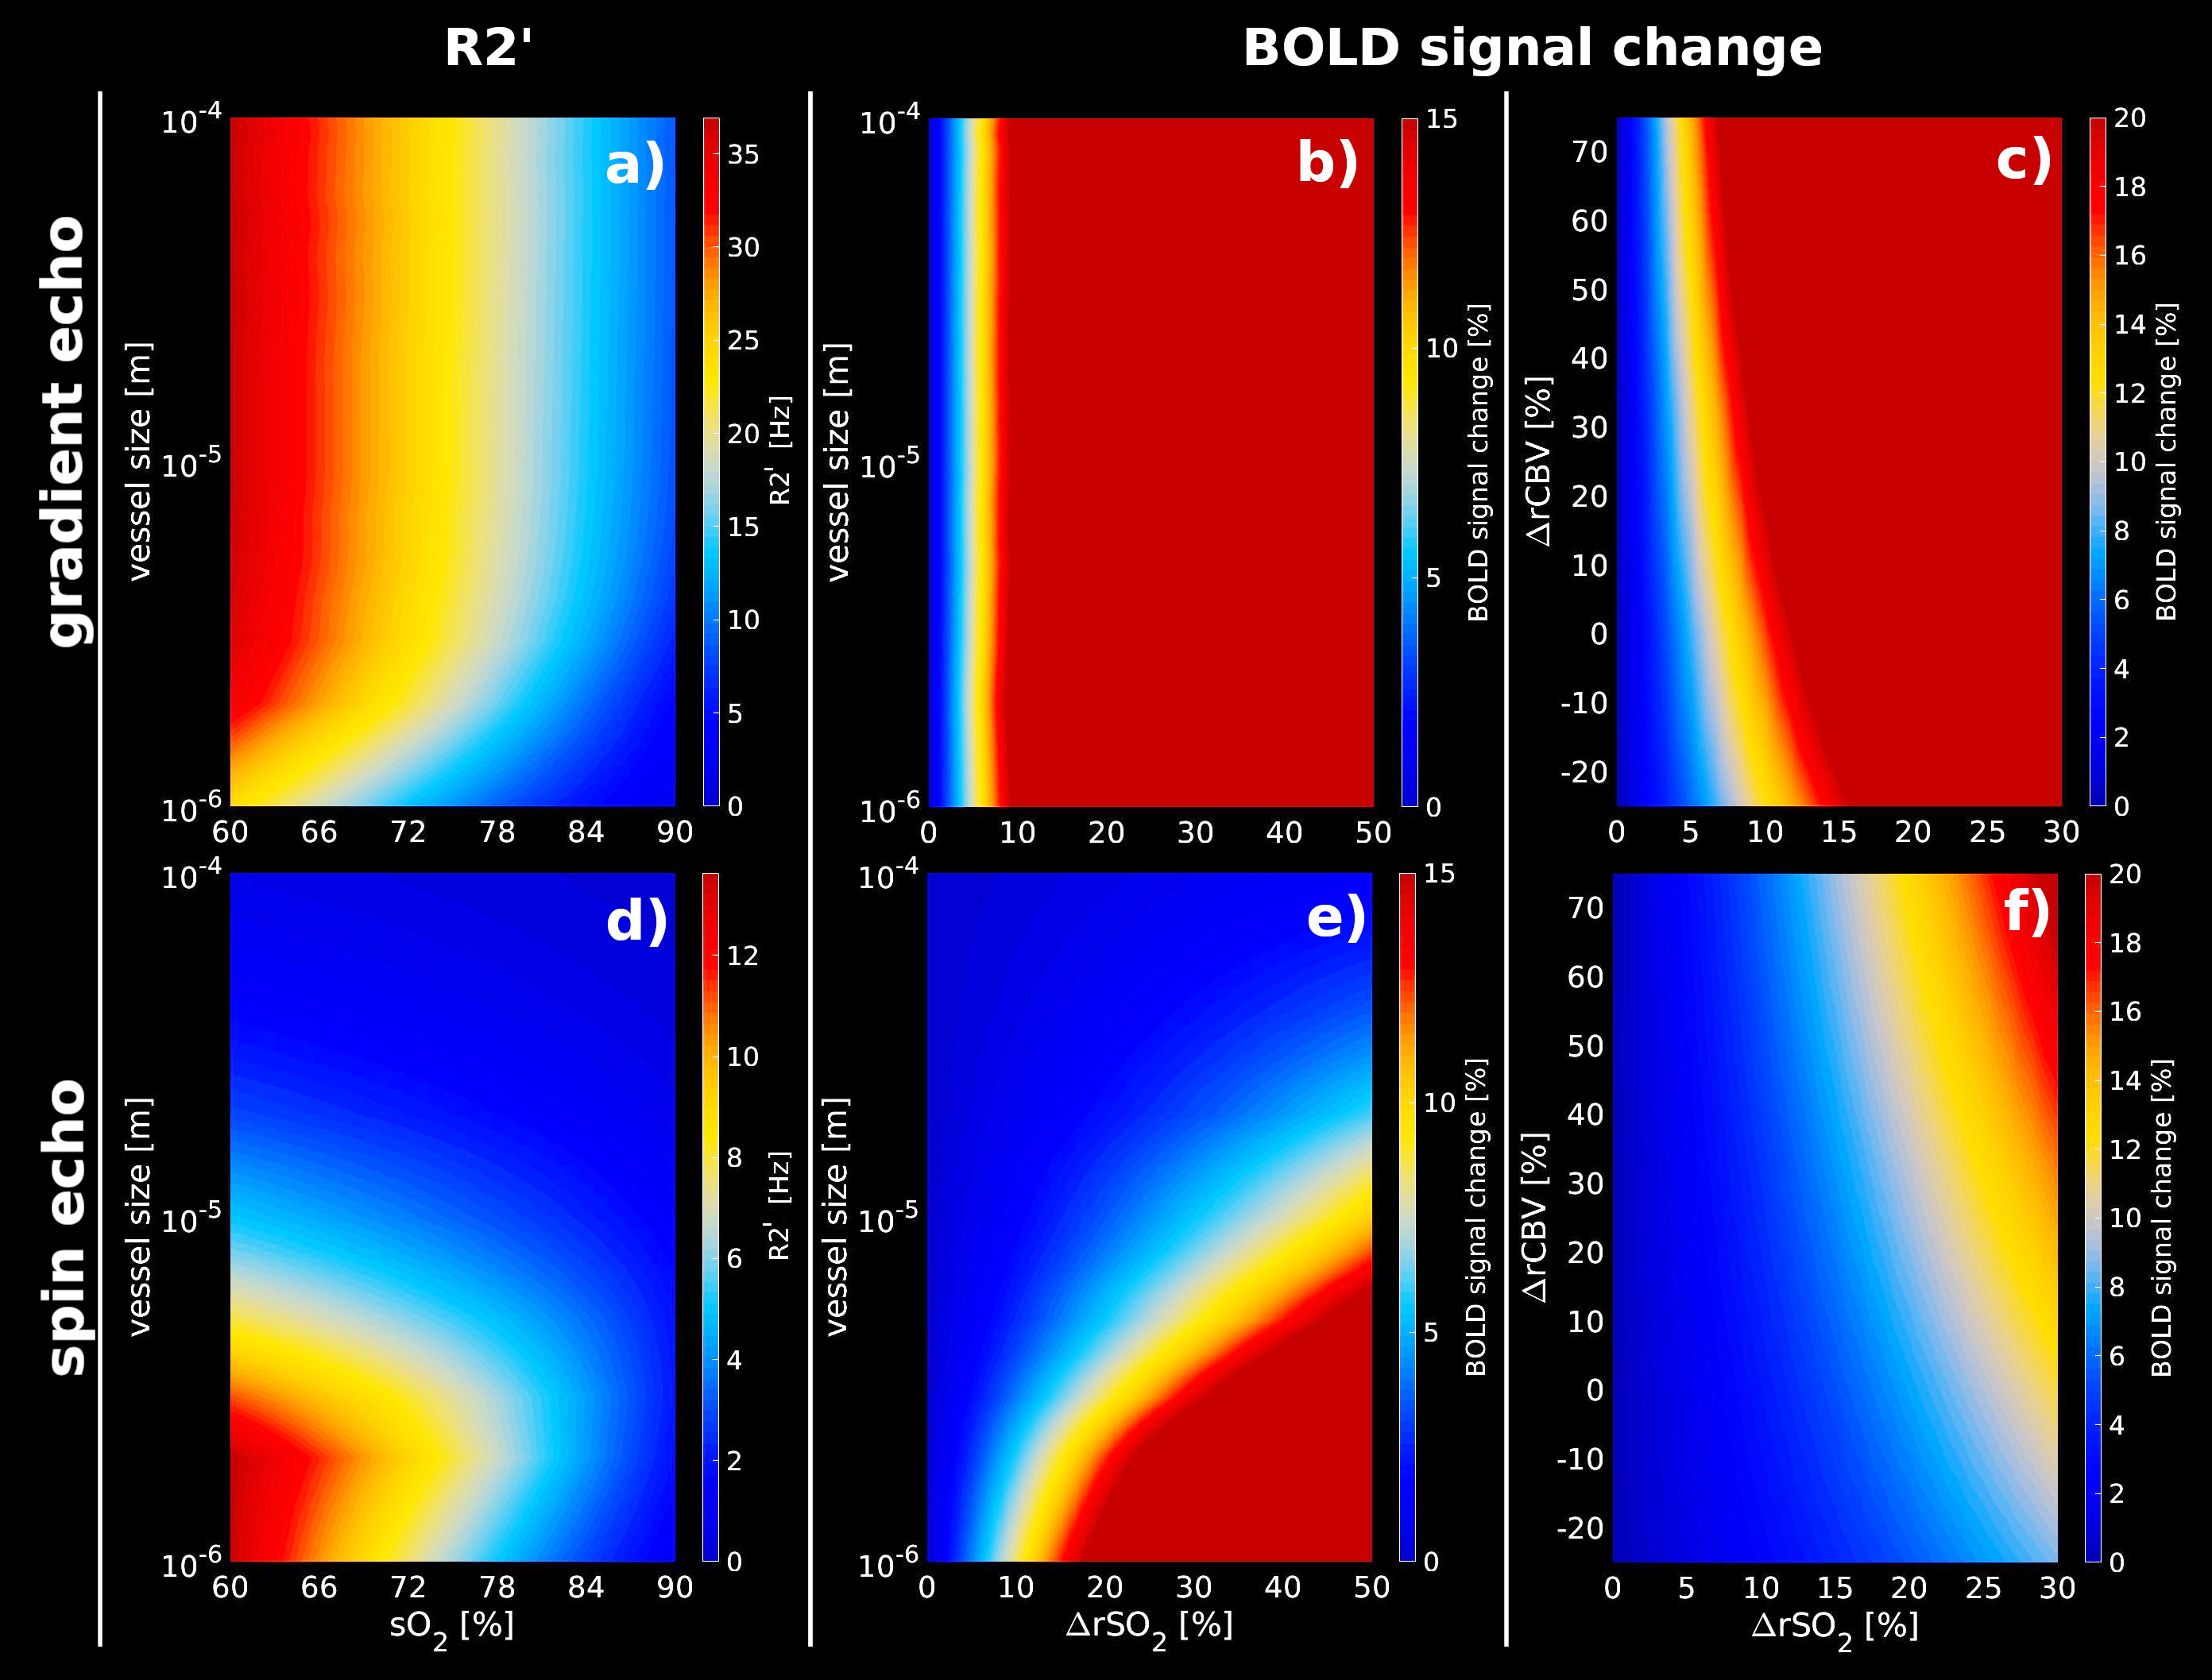
R2’
and relative BOLD-fMRI signal changes obtained from an artificial
vascular network for GE and SE at 7T assuming different SO2
and CBV changes. (a, d)R2’ calculated for different vessel sizes
–ranging from 1µm to 100µm- for GE(TE=27ms) and SE(TE=45ms).
(b, e)relative BOLD-fMRI signal change for different vessel sizes
and increments of SO2
levels for GE and SE. (c, f) relative BOLD-fMRI signal change
assuming CBV changes for GE and SE, respectively. GE shows a higher
sensitivity to small volume changes with respect to small SO2
changes in contrast to SE.