Xiaodong Li1, Yafei Bai1, Yupeng Liao1, and Sherman Xuegang Xin1
1South China University of Technology, Guangzhou, China
1South China University of Technology, Guangzhou, China
we presented a series of phantoms with adjustable parameters to quantitatively evaluate the effects of various cellular properties in tissue on the ADC measurements.
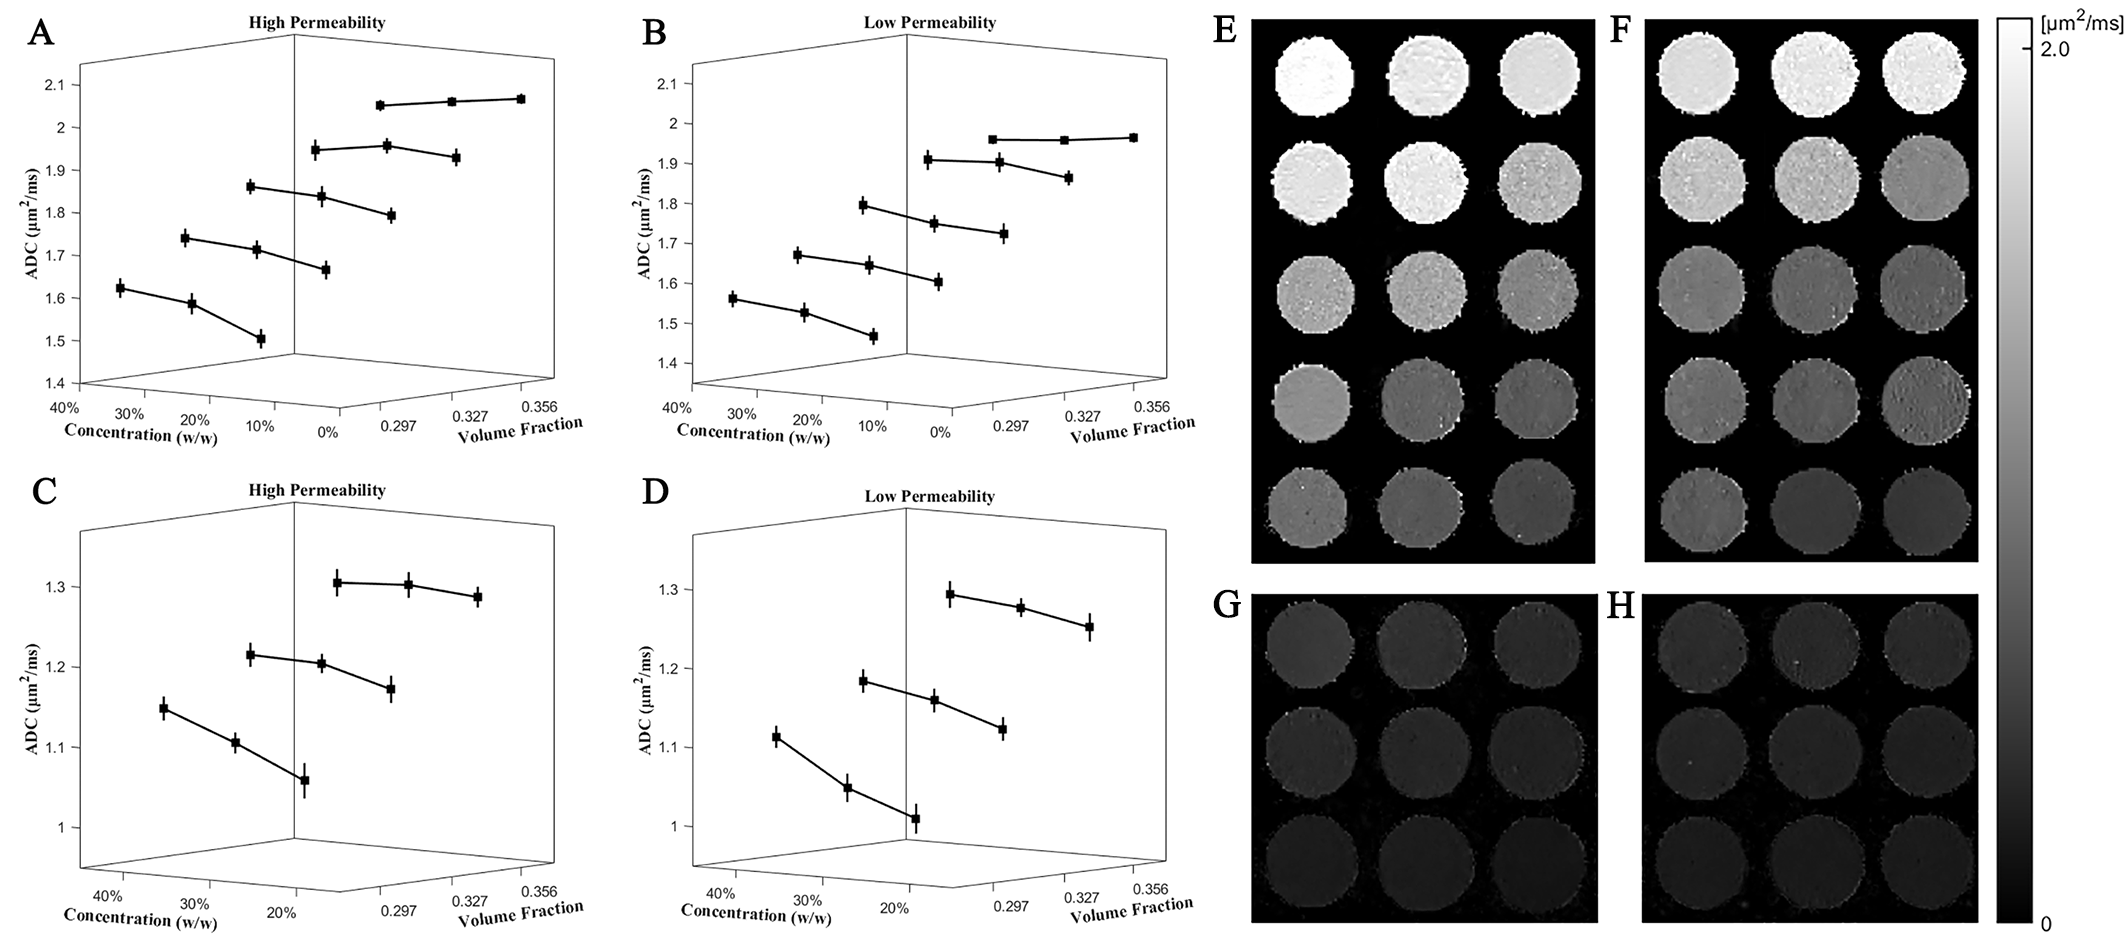
Figure 2: A-D:
ADC values of all phantoms. The
inter-fiber spaces in (A/B) and (C/D) were respectively filled with the 0% and 20% solution.
The phantom ADC values with different fiber permeabilities are shown separately. Each solid line
connects values measured from three phantoms with different volume fractions of
intra-fiber spaces. E-H: Representative ADC maps. For each subplot, the volume fractions of the intra-fiber
spaces increase from left to right, and the PVP concentration of the
intra-fiber spaces increase from top to bottom.
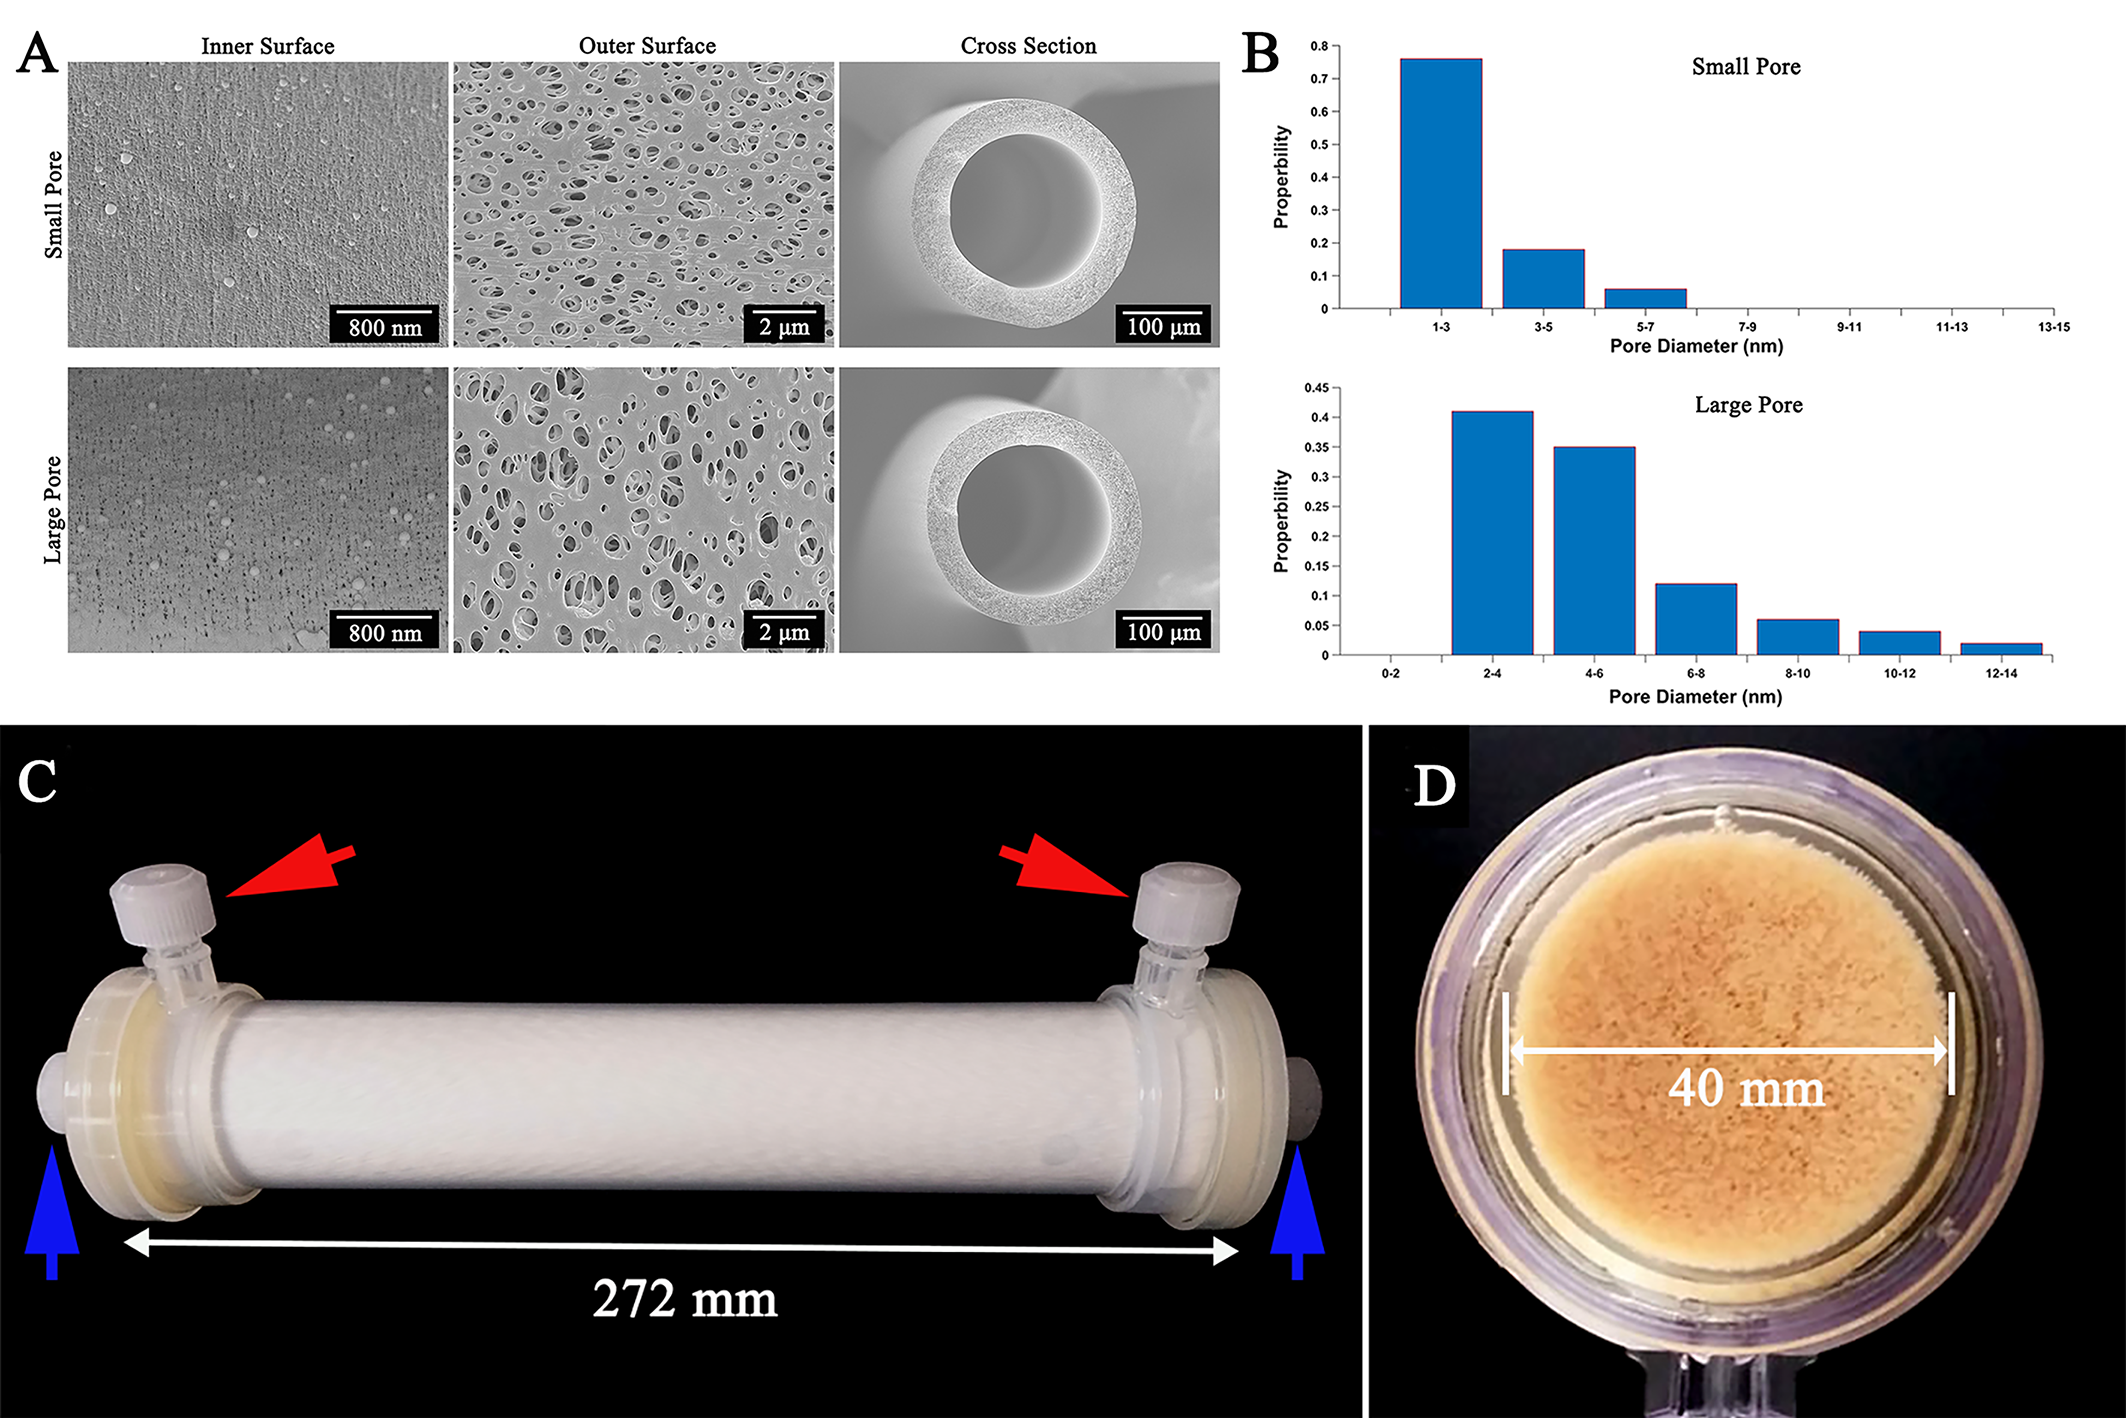
Figure 1: SEM images and
phantom photographs. A: SEM images of the hollow PES fibers with small
pore diameter (first row) and large pore diameter (second row). The images of
the inner surfaces, outer surfaces, and cross sections are shown from left to
right. B: Pore diameter distribution on the inner surface of two fibers. C:
Photograph of the entire phantom. The red
arrows point to the positions for the two openings of the inter-fiber spaces,
and the blue arrows point to the positions of the intra-fiber spaces. D: Photograph
of the potting layer.