Andrada Ianus1, Francisca F. Fernandes1, Joana Carvalho1, Cristina Chavarrias1, Marco Palombo2, and Noam Shemesh1
1Champalimaud Centre for the Unknown, Lisbon, Portugal, 2University College London, London, United Kingdom
1Champalimaud Centre for the Unknown, Lisbon, Portugal, 2University College London, London, United Kingdom
Measuring
micro-architectural features is emerging as a frontier of diffusion MRI. This
work maps apparent soma and neurite density via the SANDI methodology in
the mouse brain in-vivo at 9.4T, showing consistency between animals,
and the feasibility of shortening the acquisition protocol.

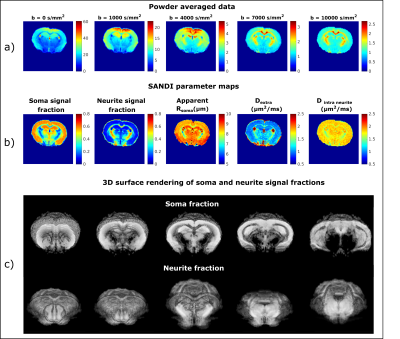
Figure 1a) b0 images and powder averaged data for
different b-values (increasing from left to right) from one representative
mouse. The SNR of b0 images is 15-25 in WM and 20-50 in GM. b) SANDI parameter maps revealing high soma signal fraction in GM,
high neurite signal fraction in WM and high extracellular diffusivity (and signal
fraction, not shown) in CSF. Apparent soma radius and intra neurite diffusivity
show less contrast between WM and GM. c) 3D surface rendering of
soma and neurite fraction obtained in ImageJ using a visualisation threshold of
0.4 and 0.2, respectively.

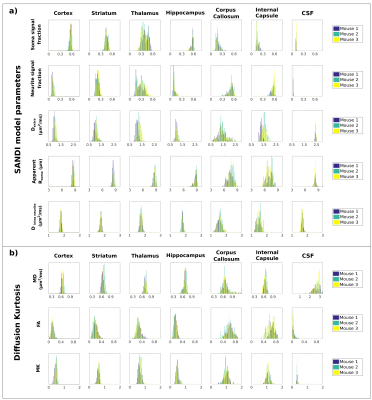
Figure 3 Histograms of a) SANDI and b) DKI parameters in
different ROIs (left to right: cortex, striatum, thalamus, hippocampus, corpus
callosum, internal capsule and CSF). Different rows represent different model
parameters, and the colours reflect the 3 mice. An overlap of the parameter
histograms is observed for most parameters and ROIs.
