Samira Mchinda1,2, Sarah Demortière3, Henitsoa Rasoanandrianina4, Claire Costes1,2, Jean Pelletier2,5, Shahram Attarian6, Aude-Marie Grapperon6, Bertrand Audoin2,5, Annie Vershueren6, and Virginie Callot1,2
1Aix-Marseille Univ, CNRS, CRMBM, Marseille, France, 2APHM, Hôpital Universitaire Timone, CEMEREM, Marseille, France, 3APHM, Hôpital Universitaire Timone, Neurology Department, Marseille, France, 4Departement of Research and Innovation, Olea Medical, La Ciotat, France, 5. APHM, Hôpital Universitaire Timone, Neurology Department, Marseille, France, 6APHM, Hôpital Universitaire Timone, Reference Center for Neuromuscular Disorders and ALS, Marseille, France
1Aix-Marseille Univ, CNRS, CRMBM, Marseille, France, 2APHM, Hôpital Universitaire Timone, CEMEREM, Marseille, France, 3APHM, Hôpital Universitaire Timone, Neurology Department, Marseille, France, 4Departement of Research and Innovation, Olea Medical, La Ciotat, France, 5. APHM, Hôpital Universitaire Timone, Neurology Department, Marseille, France, 6APHM, Hôpital Universitaire Timone, Reference Center for Neuromuscular Disorders and ALS, Marseille, France
A 3D-MP2RAGE sequence previously optimized for 3T cervical cord imaging was applied for the first time to patients with MS and ALS, and their controls. Robust, allowing for cord CSA measurements, and potential specificity to disease, the MP2RAGE may be a technique of choice for clinical studies.
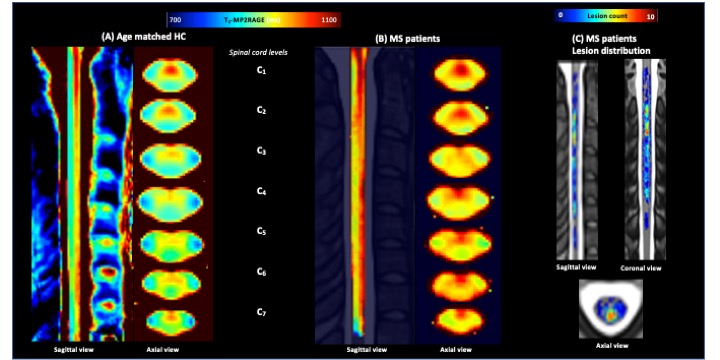
Fig.5: Mean normal appearing T1-MP2RAGE map calculated over all MS patients (B) (after lesion filling) and age matched HC (A) in the PAM50 space and lesion distribution map (C). T1 values in NA tissues were statistically higher in MS patients (NAWM= 969±64/NAGM=970±47ms) as compared to HC_MS (902±22 and 939±21). Impairments were more particularly marked in NAaiGM in the upper cervical levels and in the whole WM, especially in CST/LST (p<0.0001).
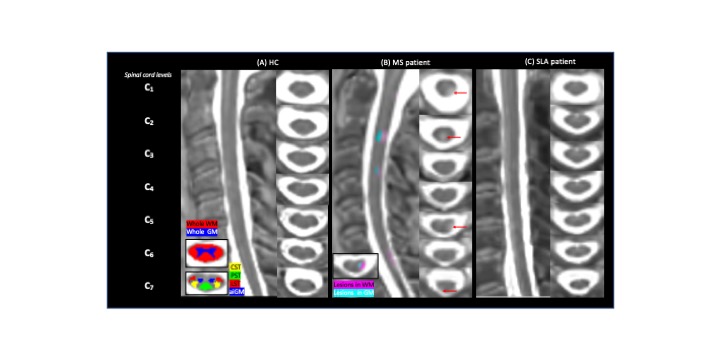
Fig.2: Representative T1-MP2RAGE maps obtained on HC (A), MS (B) and ALS (C) and the selected ROIs. For the MS patient, red arrows point on GM/WM lesions