Paola Valsasina1, Maria A. Rocca1,2,3, Claudio Gobbi4,5, Chiara Zecca4,5, Alex Rovira6, Xavier Montalban7, Hugh Kearney8, Olga Ciccarelli8, Lucy Matthews9, Jacqueline Palace9, Antonio Gallo10, Alvino Bisecco10, Achim Gass11, Philipp Eisele11, and Massimo Filippi1,2,3,12,13
1Neuroimaging Research Unit, Division of Neuroscience, IRCCS San Raffaele Scientific Institute, Milan, Italy, 2Neurology Unit, IRCCS San Raffaele Scientific Institute, Milan, Italy, 3Vita-Salute San Raffaele University, Milan, Italy, 4Multiple Sclerosis Center, Department of Neurology, Neurocenter of Southern Switzerland, Civic Hospital, Lugano, Switzerland, 5Faculty of Biomedical Sciences, Università della Svizzera Italiana, Lugano, Switzerland, 6Section of Neuroradiology, Department of Radiology, Hospital Universitari Vall d’Hebron, Barcelona, Spain, 7Department of Neurology/Neuroimmunology, Multiple Sclerosis Center of Catalonia, Hospital Universitari Vall d’Hebron, Barcelona, Spain, 8NMR Research Unit, Queen Square MS Centre, Department of Neuroinflammation, UCL Institute of Neurology, London, United Kingdom, 9Nuffield Department of Clinical Neurosciences, University of Oxford, Oxford, United Kingdom, 10Department of Advanced Medical and Surgical Sciences, and 3T MRI Center, University of Campania “Luigi Vanvitelli”, Naples, Italy, 11Department of Neurology, Universitätsmedizin Mannheim, University of Heidelberg, Mannheim, Germany, 12Neurorehabilitation Unit, IRCCS San Raffaele Scientific Institute, Milan, Italy, 13Neurophysiology Service, IRCCS San Raffaele Scientific Institute, Milan, Italy
1Neuroimaging Research Unit, Division of Neuroscience, IRCCS San Raffaele Scientific Institute, Milan, Italy, 2Neurology Unit, IRCCS San Raffaele Scientific Institute, Milan, Italy, 3Vita-Salute San Raffaele University, Milan, Italy, 4Multiple Sclerosis Center, Department of Neurology, Neurocenter of Southern Switzerland, Civic Hospital, Lugano, Switzerland, 5Faculty of Biomedical Sciences, Università della Svizzera Italiana, Lugano, Switzerland, 6Section of Neuroradiology, Department of Radiology, Hospital Universitari Vall d’Hebron, Barcelona, Spain, 7Department of Neurology/Neuroimmunology, Multiple Sclerosis Center of Catalonia, Hospital Universitari Vall d’Hebron, Barcelona, Spain, 8NMR Research Unit, Queen Square MS Centre, Department of Neuroinflammation, UCL Institute of Neurology, London, United Kingdom, 9Nuffield Department of Clinical Neurosciences, University of Oxford, Oxford, United Kingdom, 10Department of Advanced Medical and Surgical Sciences, and 3T MRI Center, University of Campania “Luigi Vanvitelli”, Naples, Italy, 11Department of Neurology, Universitätsmedizin Mannheim, University of Heidelberg, Mannheim, Germany, 12Neurorehabilitation Unit, IRCCS San Raffaele Scientific Institute, Milan, Italy, 13Neurophysiology Service, IRCCS San Raffaele Scientific Institute, Milan, Italy
Longitudinal, voxel-wise
analysis of patients with
multiple sclerosis showed that
cervical cord atrophy progressed at 1-year follow-up, was more widespread in
relapsing-remitting MS than in other phenotypes and
predicted 1-year clinical disability.
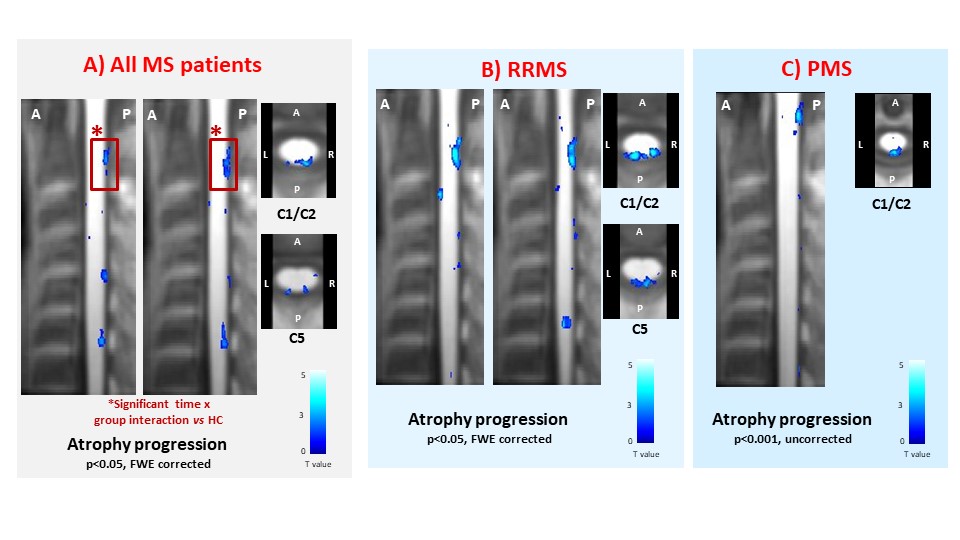
Figure 2. Sagittal and axial views at
various cervical cord levels showing clusters of significant cord atrophy progression
at 1-year follow-up (color-coded for t-values, p<0.001 for display purposes)
in: A) multiple sclerosis (MS) patients, considered as a whole; B)
relapsing-remitting (RR) MS patients; and C) progressive (P) MS patients. Red
boxes indicate clusters of cord atrophy progression significant at the time x group interaction vs HC. Abbreviations: L=left; R=right; A=anterior; P=posterior.
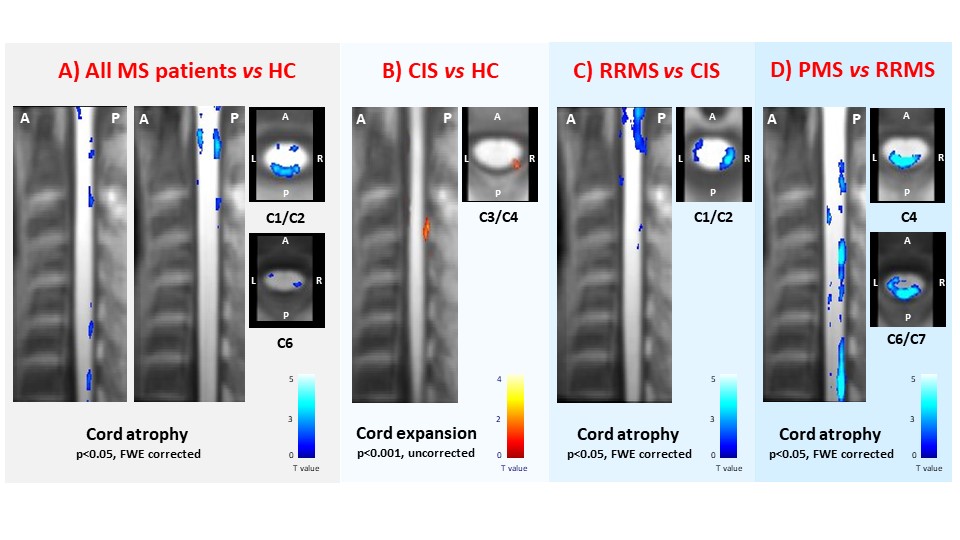
Figure 1. Sagittal and axial views at
various cervical cord levels showing clusters of significant cord atrophy
differences (color-coded for t-values, p<0.001 for display purposes) in: A)
multiple sclerosis (MS) patients, considered as a whole, vs healthy controls (HC); B) clinically isolated syndrome (CIS)
patients vs HC; C)
relapsing-remitting (RR) MS vs CIS
patients; and D) progressive (P) MS vs
RRMS patients. Abbreviations: L=left; R=right; A=anterior; P=posterior.