Silvan Büeler1, Patrick Freund2,3,4,5, Martina Liechti1, and Gergely David1,2
1Department of Neuro-Urology, Balgrist University Hospital, University of Zurich, Zurich, Switzerland, 2Spinal Cord Injury Center, Balgrist University Hospital Zurich, University of Zurich, Zurich, Switzerland, 3Department of Brain Repair and Rehabilitation, UCL Institute of Neurology, London, United Kingdom, 4Department of Neurophysics, , Max Planck Institute for Human Cognitive and Brain Sciences, Leipzig, Germany, 5Wellcome Trust Centre for Neuroimaging, UCL Institute of Neurology, London, United Kingdom
1Department of Neuro-Urology, Balgrist University Hospital, University of Zurich, Zurich, Switzerland, 2Spinal Cord Injury Center, Balgrist University Hospital Zurich, University of Zurich, Zurich, Switzerland, 3Department of Brain Repair and Rehabilitation, UCL Institute of Neurology, London, United Kingdom, 4Department of Neurophysics, , Max Planck Institute for Human Cognitive and Brain Sciences, Leipzig, Germany, 5Wellcome Trust Centre for Neuroimaging, UCL Institute of Neurology, London, United Kingdom
When imaging the lumbosacral cord with a multi-echo
gradient-echo sequence, we recommend a minimum of 3 and maximum of 4 echoes as
an optimal trade-off between segmentability and artifact level, and 6 signal
averages (or measurements) for robust segmentations of gray and white matter.
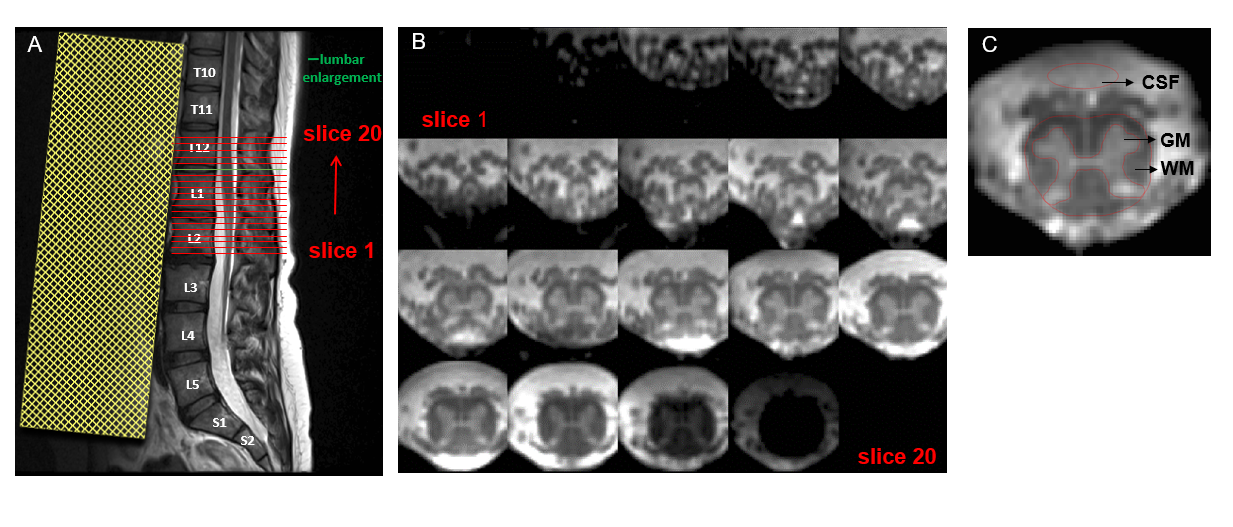
Fig. 1: A: T2-weighted sagittal turbo spin
echo image of the lower spine used for slice positioning. The 20 axial-oblique
slices are positioned individually in each subject to encompass the lumbar enlargement and the
conus medullaris. B: Corresponding axial
slices from caudal (slice 1) to rostral (slice 20) direction. C: In each
slice (here: slice 14 is shown), spinal cord and gray matter (GM) are segmented
manually and a cerebrospinal fluid (CSF) mask is defined anterior to the spinal
cord. The white matter (WM) mask is obtained by subtracting SC and GM masks.
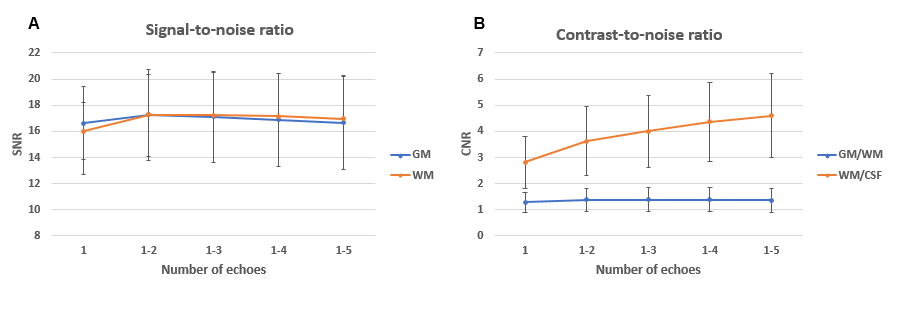
Fig. 3: Dependency of signal-to-noise ratio (SNR) of gray matter (GM) (blue curve) and white matter (WM) (orange
curve) on the number of echoes. The two curves run largely similar, increasing
from 1 to 2 echoes and minimally decreasing afterwards. B: Dependency of contrast-to-noise ratio (CNR) between
GM/WM (blue curve) and WM/CSF (orange curve) on the number of echoes. While
WM/CSF CNR steadily increases with more echoes, the WM/CSF contrast exhibits a
very flat peak at 3-4 echoes. In both subplots, error bars represent standard
deviation across subjects (n=10).