Arkiev D'Souza1, Chenyu Wang1,2, Sicong Tu1,2, Dominic Soligo3, Matthew Kiernan1,2,4, Michael Barnett1,4, and Fernando Calamante1,5,6
1Brain and Mind Centre, The University of Sydney, Sydney, Australia, 2Central Clinical School, The University of Sydney, Sydney, Australia, 3I-MED Radiology Network, Camperdown, Australia, 4Department of Neurology, Royal Prince Alfred Hospital, Camperdown, Australia, 5School of Biomedical Engineering, The University of Sydney, Sydney, Australia, 6Sydney Imaging, The University of Sydney, Sydney, Australia
1Brain and Mind Centre, The University of Sydney, Sydney, Australia, 2Central Clinical School, The University of Sydney, Sydney, Australia, 3I-MED Radiology Network, Camperdown, Australia, 4Department of Neurology, Royal Prince Alfred Hospital, Camperdown, Australia, 5School of Biomedical Engineering, The University of Sydney, Sydney, Australia, 6Sydney Imaging, The University of Sydney, Sydney, Australia
A sample size of 22 would be sufficient to detect 10% difference in track-weighted metrics studied. A sample size of 20 would be large enough to detect within-subject differences as small as 3% and between-subject differences as small as 4%.
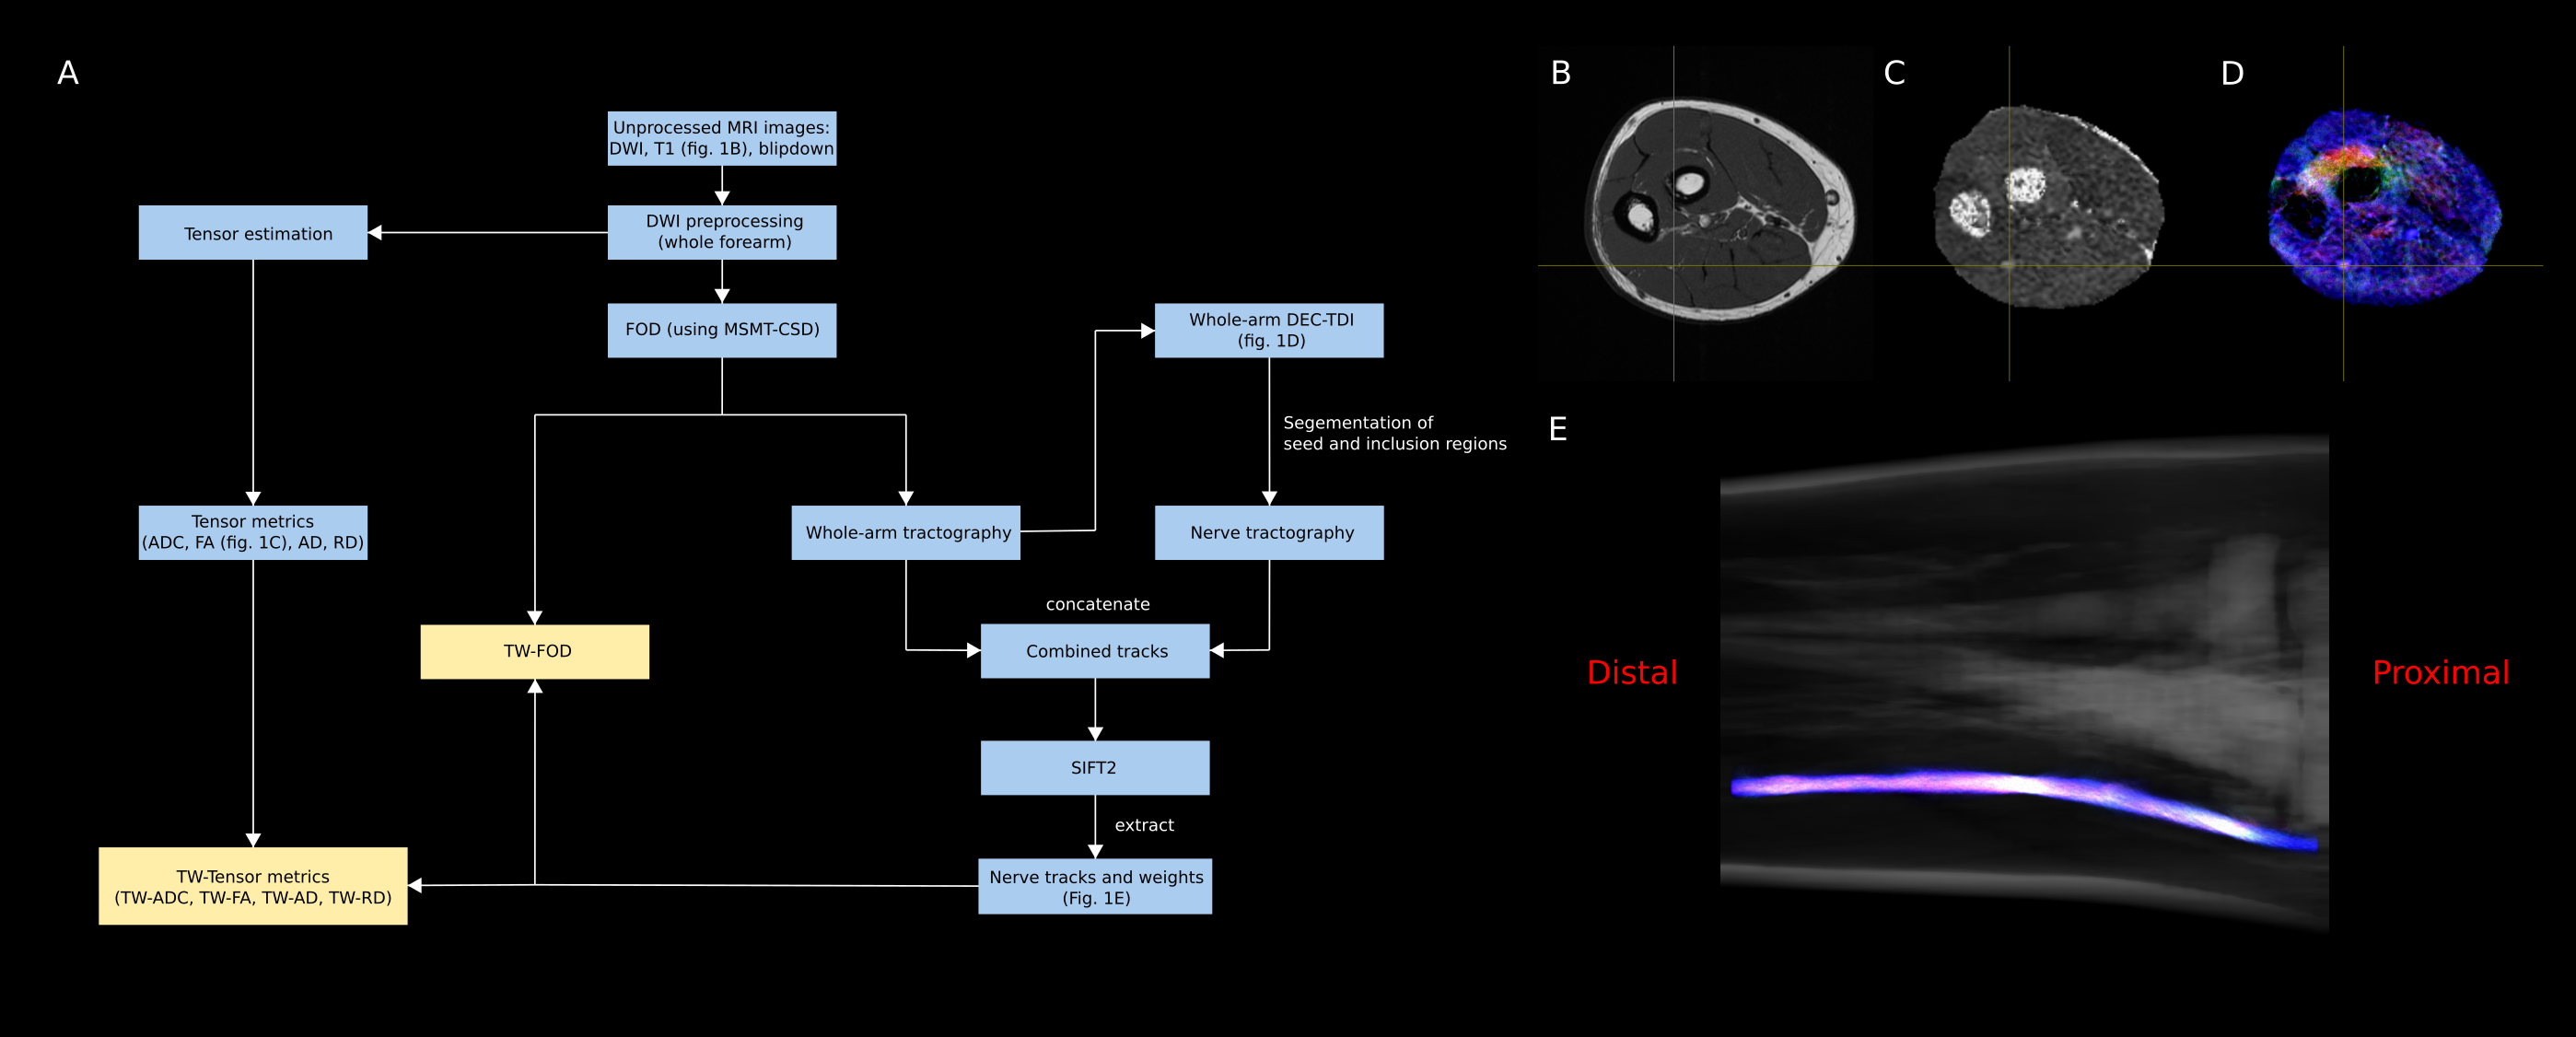
Figure 1: (A) schematic of framework methods. Axial image of the forearm from (B) T1-weighted anatomical image, (C) FA map, (D) DEC-TDI. In B-D, the axis is centred at the same location. (E) shows a three-dimensional reconstruction of the ulnar nerve generated by volume rendering the nerve DEC-TDI image and overlaying on semi-opaque T1 volume render. In D and E, the colours indicate directionality (red for left-right, blue for proximal-distal, and green for anterior-posterior).
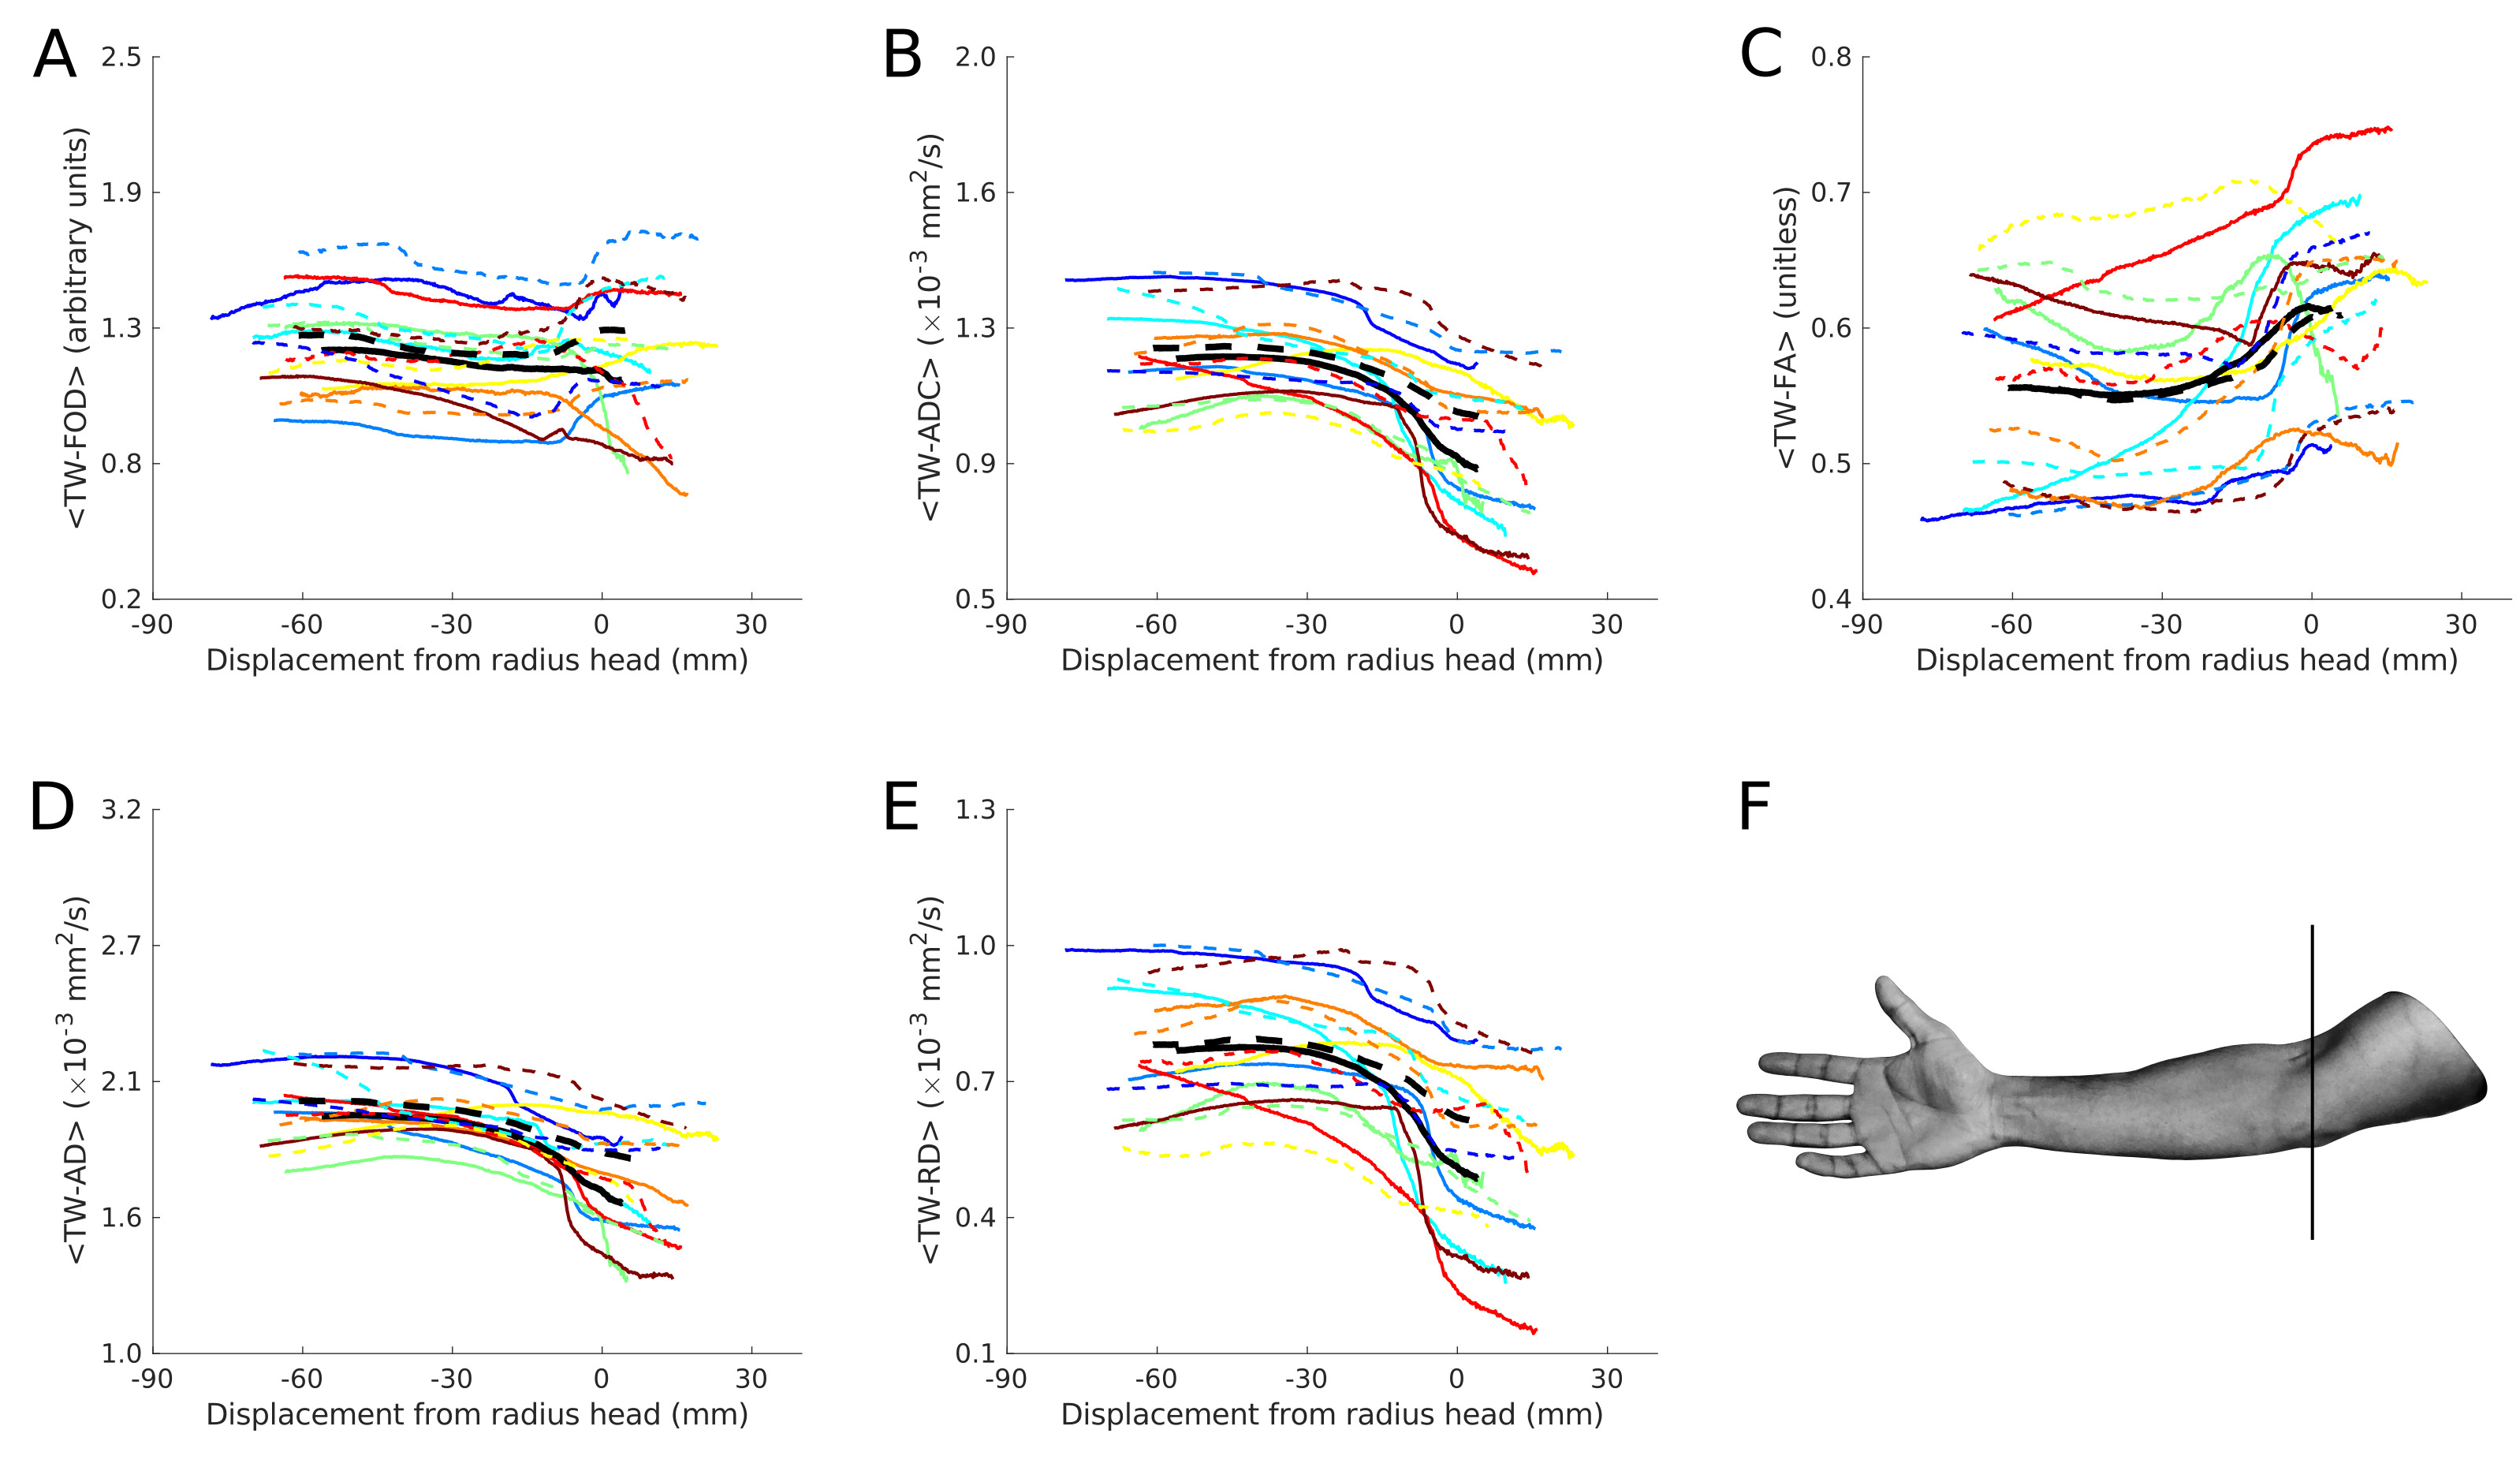
Figure 2: Measurements of (A) track-weighted fibre orientation distribution, (B) track-weighted apparent diffusion coefficient, (C) track-weighed fractional anisotropy, (D) track-weighted axial diffusivity and (E) track-weighted radial diffusivity. Profiles have been realigned such that a displacement of 0 mm roughly corresponds with the head of the radial bone, shown as vertical black line in (F). Individual subject test and re-test measurements are colour matched, and are shown with solid and dashed lines, respectively. Average test and average re-test are shown in black.