Ju Young Lee1, Andreas Mack2, Thomas Shiozawa-Bayer2, Marc Himmelbach3, Gisela Hagberg1,4, and Klaus Scheffler1,4
1Max Planck Institute for Biological Cybernetics, Tübingen, Germany, 2Eberhard Karls University Tuebingen, Tübingen, Germany, 3Hertie-Institue for Clinical Brain Research, Tübingen, Germany, 4University Hospital Tübingen, Tübingen, Germany
1Max Planck Institute for Biological Cybernetics, Tübingen, Germany, 2Eberhard Karls University Tuebingen, Tübingen, Germany, 3Hertie-Institue for Clinical Brain Research, Tübingen, Germany, 4University Hospital Tübingen, Tübingen, Germany
The present study investigates layer specific MR properties in superior colliculus using post mortem sample at 14.1T. We observed R2* maximum that likely corresponds to layer III, and high R2* and R1 in an area likely corresponding to layer VII.
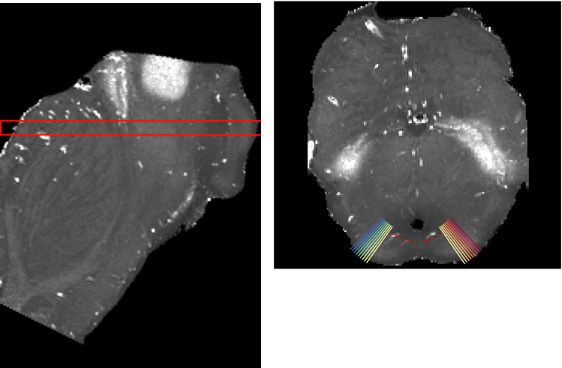
Figure 1. R2* map of sample 4. The left figure is a sagittal plane of the sample. Slides within the red lines were selected for superior colliculus depth analysis. The right figure is an axial plane of the sample. Red dash line is the second order polynomial fit to the boundary between periaqueductal gray and superior colliculus. The solid lines in different colors are the orthogonal vectors that were used for the depth analysis.
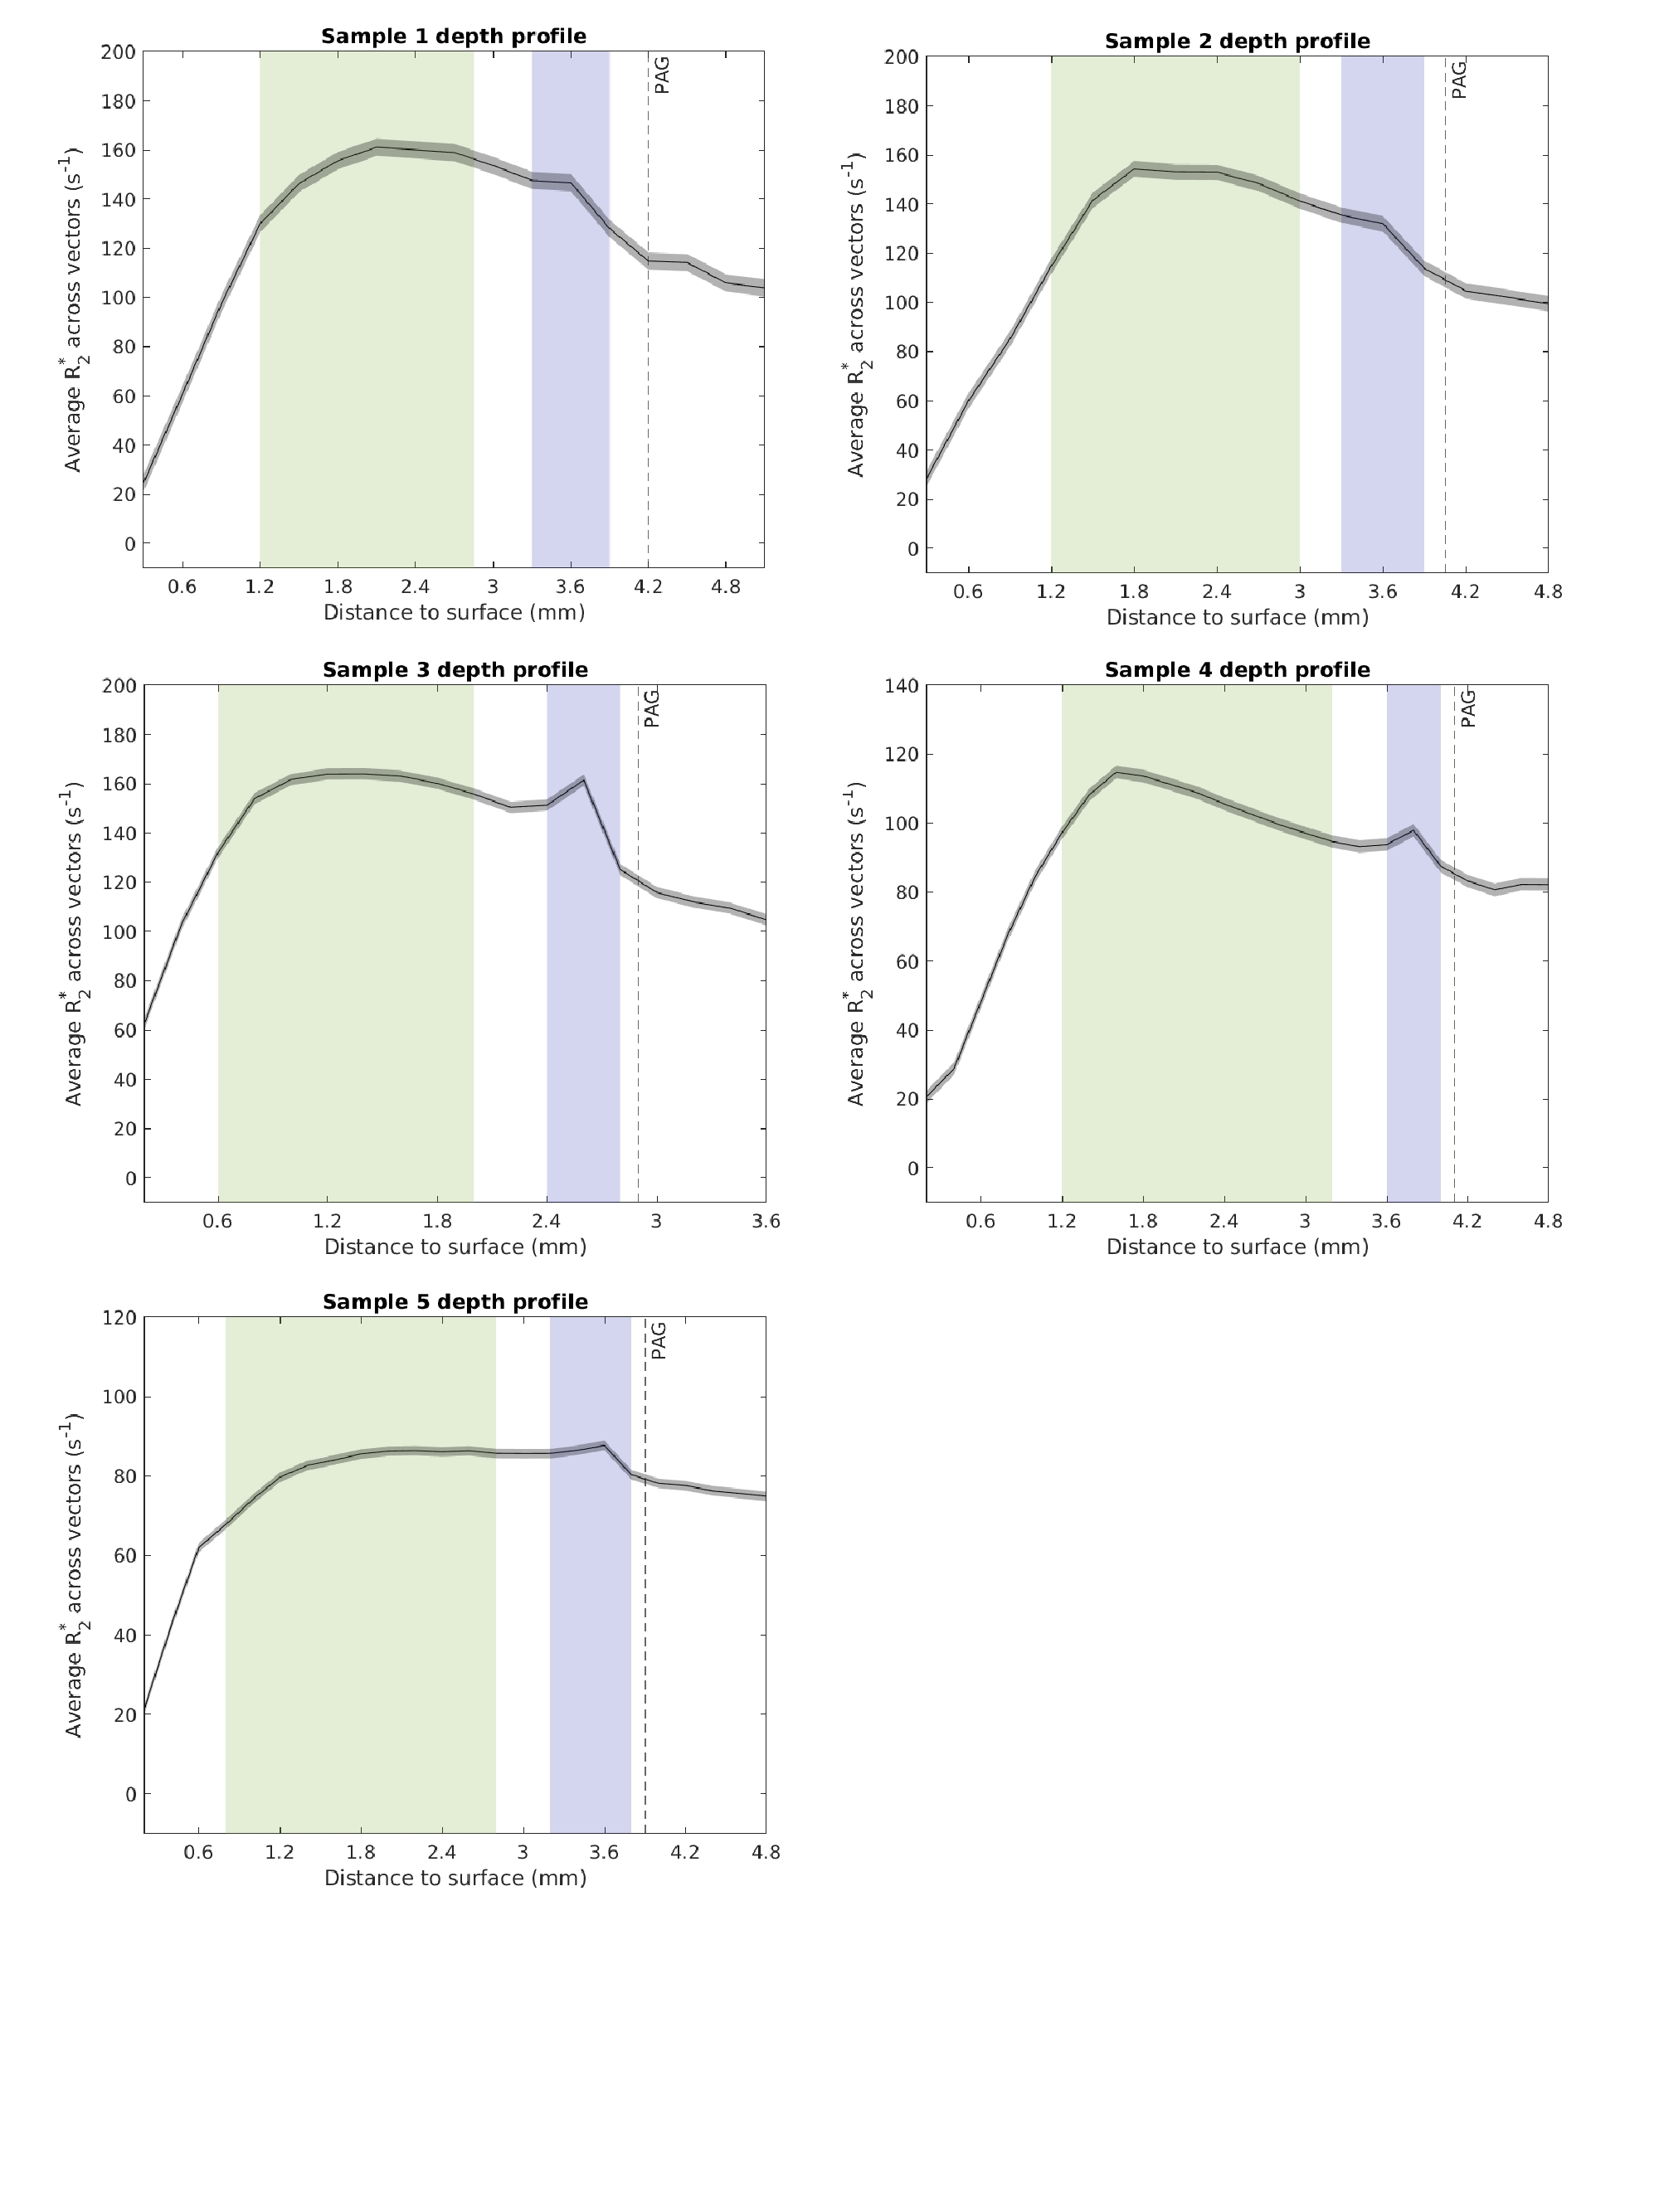
Figure 3. R2* depth profile along the superior colliculus layers. The green region indicates the intermediate layers and the purple region indicates the deepest layer. Solid black lines plot the mean R2* of all vectors in all selected axial planes (95 % confidence interval in shaded grey). Dashed black lines indicates the starting point of the periaqueductal gray. Samples 3 and 4 show one peak in the intermediate layer and another peak in the deep layer. Sample 1and 2 shows similar trend. PAG : periaqueductal gray