Ho-Fung Chan1, Guilhem J Collier1, Madhwesha Rao1, and Jim M Wild1
1Infection, Immunity and Cardiovascular Disease, University of Sheffield, Sheffield, United Kingdom
1Infection, Immunity and Cardiovascular Disease, University of Sheffield, Sheffield, United Kingdom
A small bias towards increased 129Xe ADC and LmD values at 3T was obtained, when compared to 1.5T. This bias is smaller than the reported bias with 3He and is similar to the reported 129Xe DW-MRI inter-scan repeatability differences.
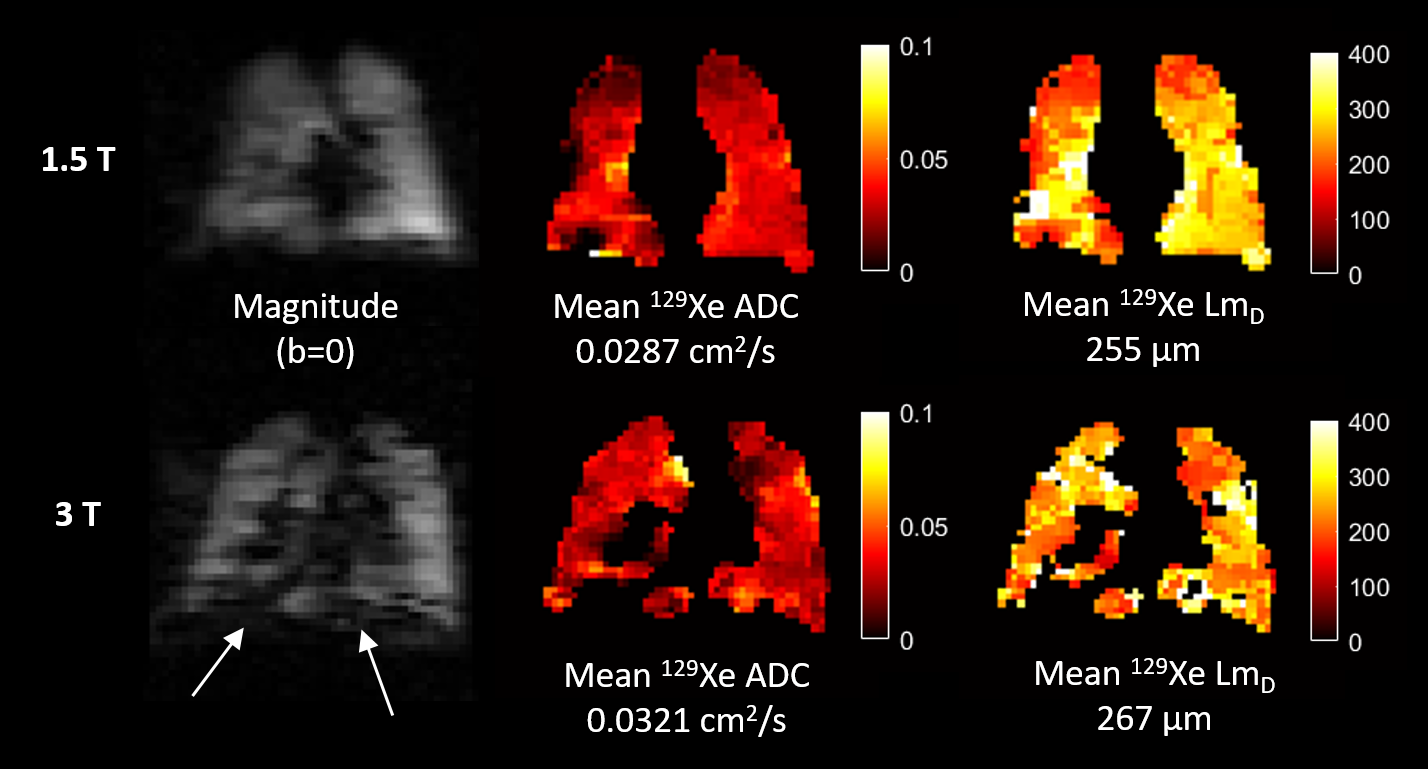
Figure 1: Example single slice 129Xe
images from Healthy Volunteer 5. (Top) Magnitude (b=0), ADC map, and LmD
map for data acquired at 1.5T. (Bottom) The equivalent images acquired at 3T.
The white arrows denote regions around the diaphragm where magnetic susceptibility
differences can be observed that are not present at 1.5T.
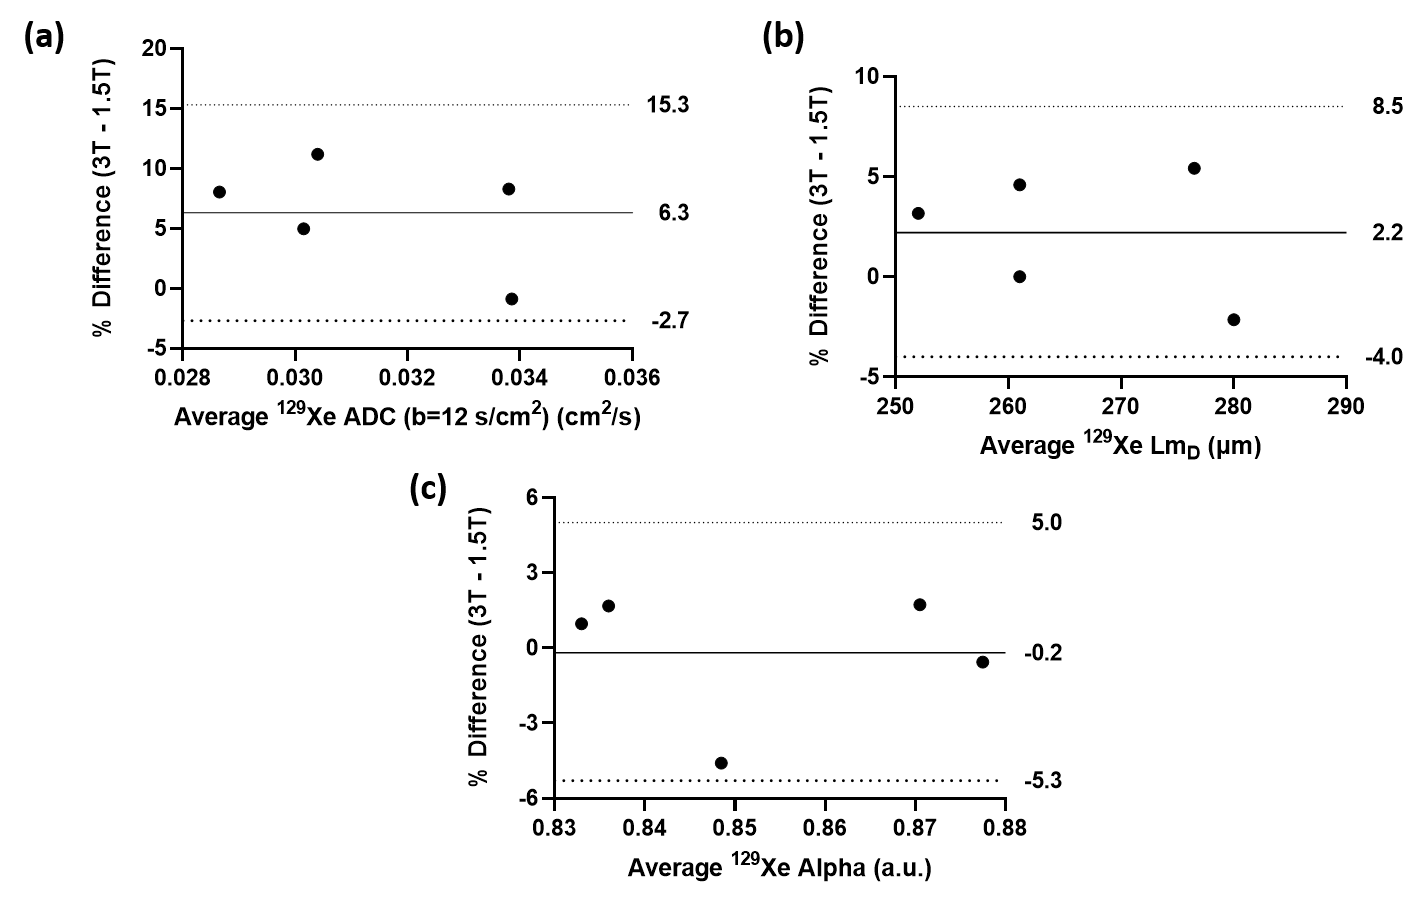
Figure 2: (a) Bland-Altman
comparison of mean global 129Xe ADC (b=12) at 3T and 1.5T for the
five healthy volunteers. A mean bias of 6.3% (solid line) towards 3T was
observed with a 95% confidence interval of -2.7% to 15.3% (dotted lines). (b)
Bland-Altman comparison of mean global 129Xe LmD with a
mean bias of 2.2% towards 3T and a 95% confidence interval of -4.0% to 8.5%.
(c) Bland-Altman comparison of mean global 129Xe alpha heterogeneity
index with a mean bias of -0.2% towards 3T and a 95% confidence interval of
-5.3% to 5.0%.