Qianhui Dou1, Aaron K. Grant1, Cody K. Callahan1, Muneeb Ahmed1, and Leo Lee Tsai1
1Radiology, Beth Israel Deaconess Medical Center, Boston, MA, United States
1Radiology, Beth Israel Deaconess Medical Center, Boston, MA, United States
Hyperpolarized 13C
MRI measurements of lactate and alanine flux correlates with tumor growth
following stimulation by nearby hepatic thermal ablation, but this is reliant on
the sufficient expression of key glycolytic modulators.
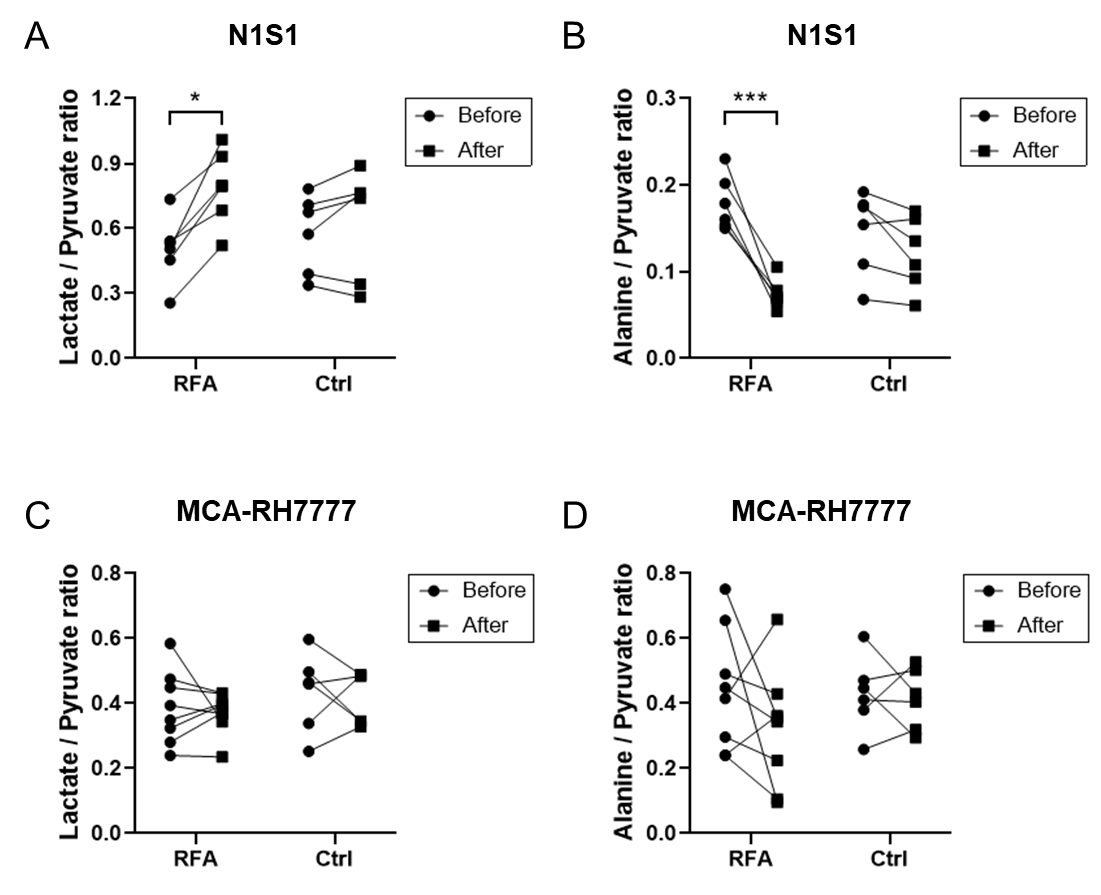
Figure
1. Lactate and alanine
flux within N1S1 and MCA-RH7777 tumors as measured with h13C
MRI. Lactate/pyruvate (A) and alanine/ pyruvate (B) ratios measured in N1S1
tumors before and 72 hours after RFA versus sham (control) treatments. Lactate/
pyruvate (C) and alanine/ pyruvate (D) ratios in MCA-RH7777 tumors before and 72 hours after RFA versus sham (control) treatments. *, p<0.05, ***,
p<0.001.
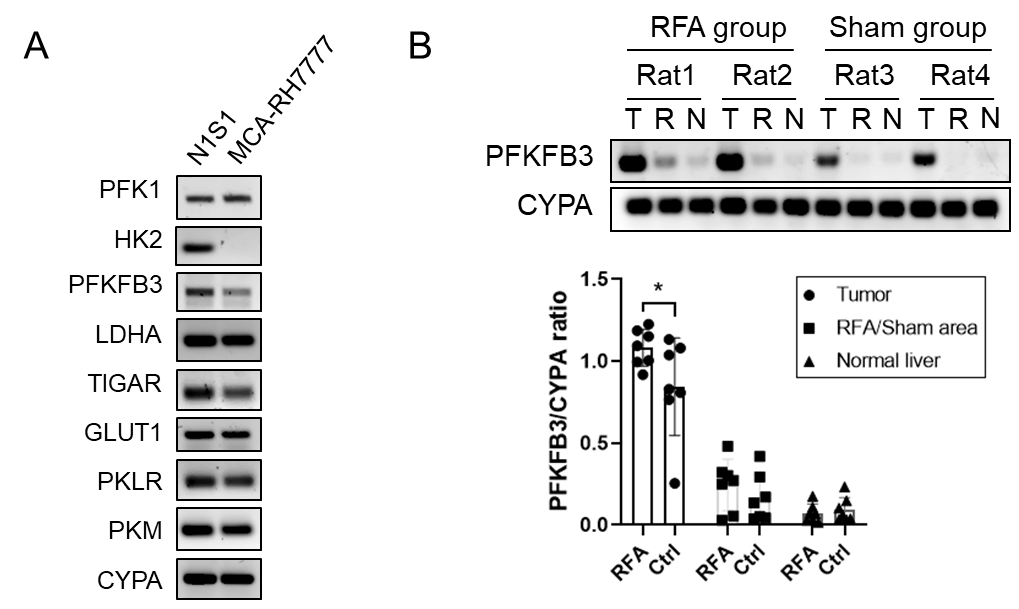
Figure 2. N1S1 and MCA-RH7777 tumor glycolysis-related
mRNA expression following treatment. (A) Glycolysis-related gene expression
pattern in N1S1 and MCA-RH7777 cell line. (B) PFKFB3 expression in N1S1 tumor
(T), adjacent normal liver (N) and RFA/sham site (R), for RFA and sham
(control) arms. Quantification of band intensity is presented as % of relative
densitometry normalized to the CYPA gene. *, p<0.05.