Joao Piraquive1, Hongjuan Zhao2, Rosalie Nolley2, Robert Bok1, James D. Brooks2, Donna M. Peehl1, John Kurhanewicz1, and Renuka Sriram1
1Department of Radiology and Biomedical Imaging, University of California San Francisco, University of California San Francisco, San Francisco, CA, United States, 2Department of Urology, Stanford University, Stanford, CA, United States
1Department of Radiology and Biomedical Imaging, University of California San Francisco, University of California San Francisco, San Francisco, CA, United States, 2Department of Urology, Stanford University, Stanford, CA, United States
The present study showed that morphological similarities persisted in PDXs, whereas the glycolytic capacity was significantly increased in the latter passage, implying natural selection of the more aggressive cells.
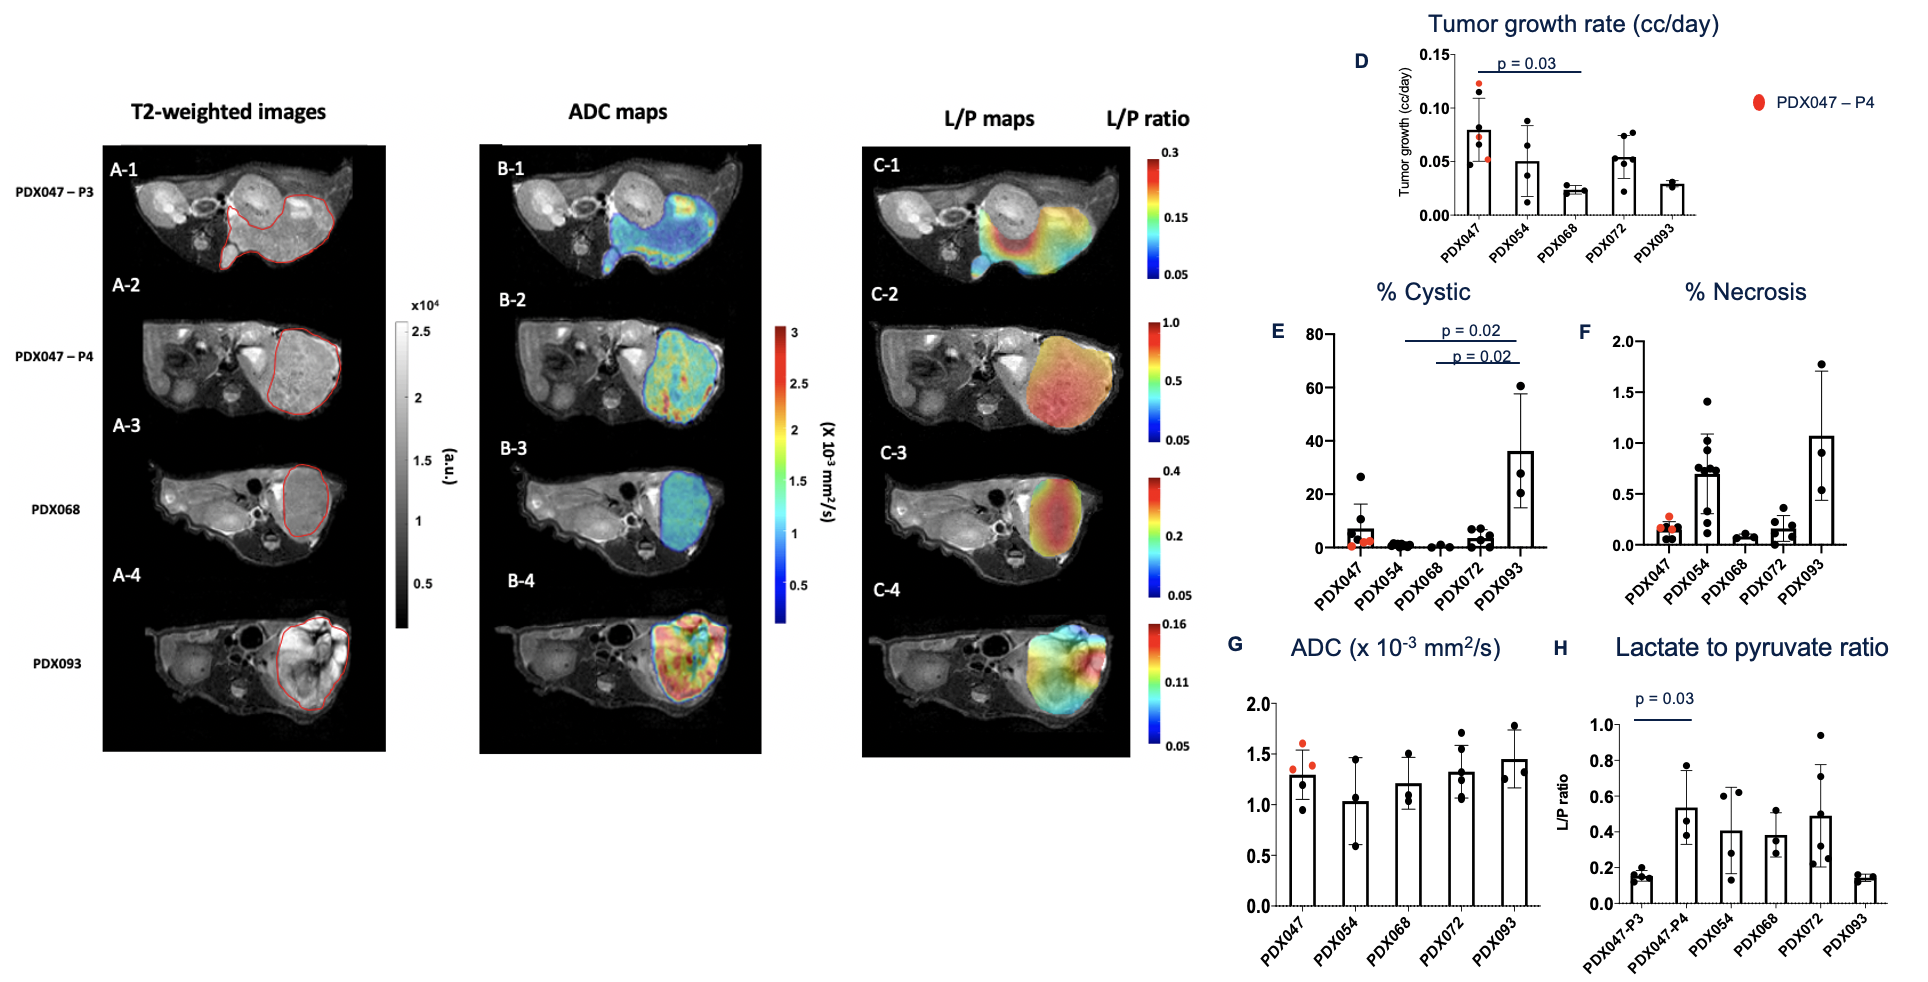
Figure
1. Imaging comparison between PDXs. Images show differences in tumor morphology
(A1-A4), tumor cellularity (B-1-B4) and tumor glycolysis in tumors (C-1-C-4).
D) Bar graph shows the mean %cystic component and F) %necrosis component. G)
Bar graph of the ADC mean calculated for all tumor slices. H) Bar graph of the
lactate to pyruvate conversion rate in tumors. a.u.: arbitrary units.a.u.:
arbitrary units. The significance of the Dunn’s post-test. Red dots in bar
graphs indicate passage 3 and 4 of PDX047.
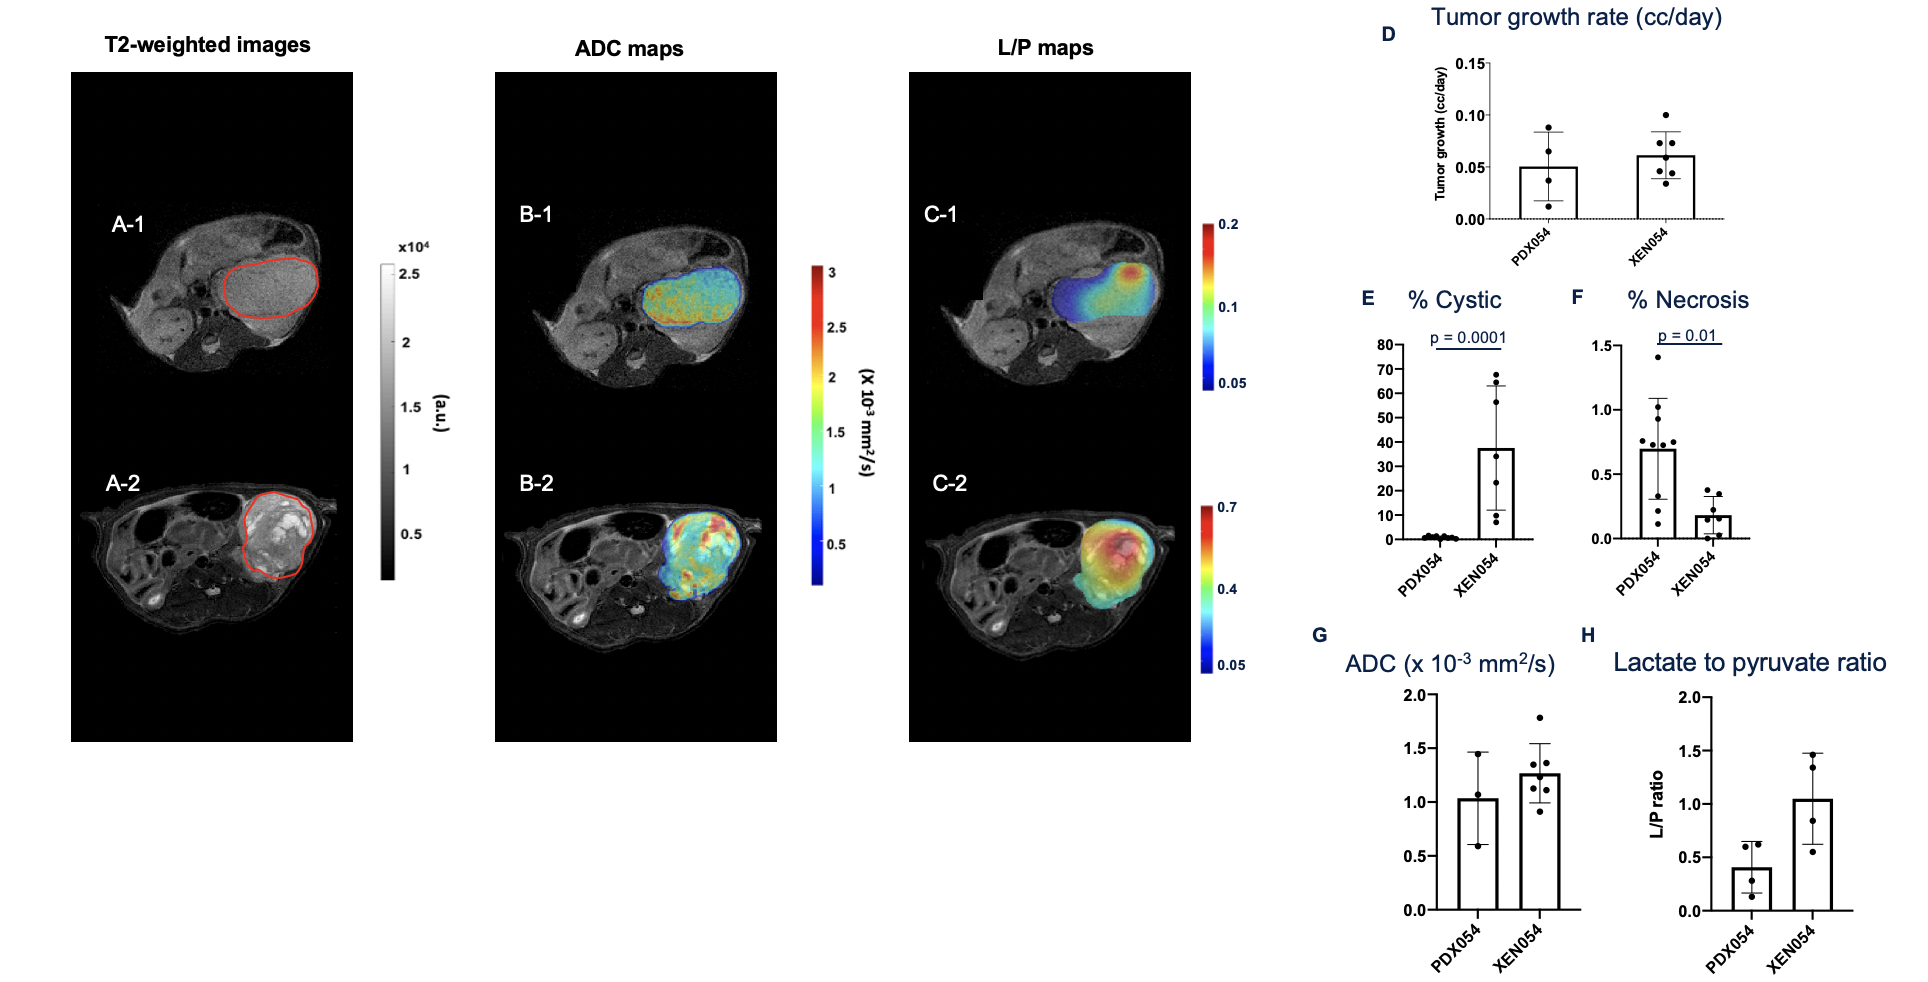
Figure
2. Imaging comparison between PDX054 and its xenograft XEN054. Images show
differences in tumor morphology (A1-A4), tumor cellularity (B-1-B4) and tumor
glycolysis in tumors (C-1-C-2). D) Bar graph shows the mean %cystic component
and F) %necrosis component. G) Bar graph of the ADC mean calculated for all
tumor slices. H) Bar graph of the lactate to pyruvate conversion ratio in
tumors. a.u.: arbitrary units. The significance of the Mann-Whitney test is
indicated above the plots. All p < 0.05 indicated statistical
significance.