Junjie Ma1, Crystal E. Harrison1, James Ratnakar1, Galen D. Reed2, Rolf F. Schulte3, Vlad G. Zaha1,4, Craig R. Malloy1,4,5, and Jae Mo Park1,5,6
1Advanced Imaging Research Center, UT SOUTHWESTERN MEDICAL CENTER, Dallas, TX, United States, 2GE Healthcare, Dallas, TX, United States, 3GE Healthcare, Munich, Germany, 4Internal Medicine, UT Southwestern Medical Center, Dallas, TX, United States, 5Radiology, UT Southwestern Medical Center, Dallas, TX, United States, 6Electrical and Computer Engineering, UT Dallas, Richardson, TX, United States
1Advanced Imaging Research Center, UT SOUTHWESTERN MEDICAL CENTER, Dallas, TX, United States, 2GE Healthcare, Dallas, TX, United States, 3GE Healthcare, Munich, Germany, 4Internal Medicine, UT Southwestern Medical Center, Dallas, TX, United States, 5Radiology, UT Southwestern Medical Center, Dallas, TX, United States, 6Electrical and Computer Engineering, UT Dallas, Richardson, TX, United States
In vivo T2*s
of hyperpolarized metabolites were consistent along the time, but largely
varied between organs, highlighting the importance of
organ-/metabolite-specific consideration of T2* in data acquisition
and interpretation.
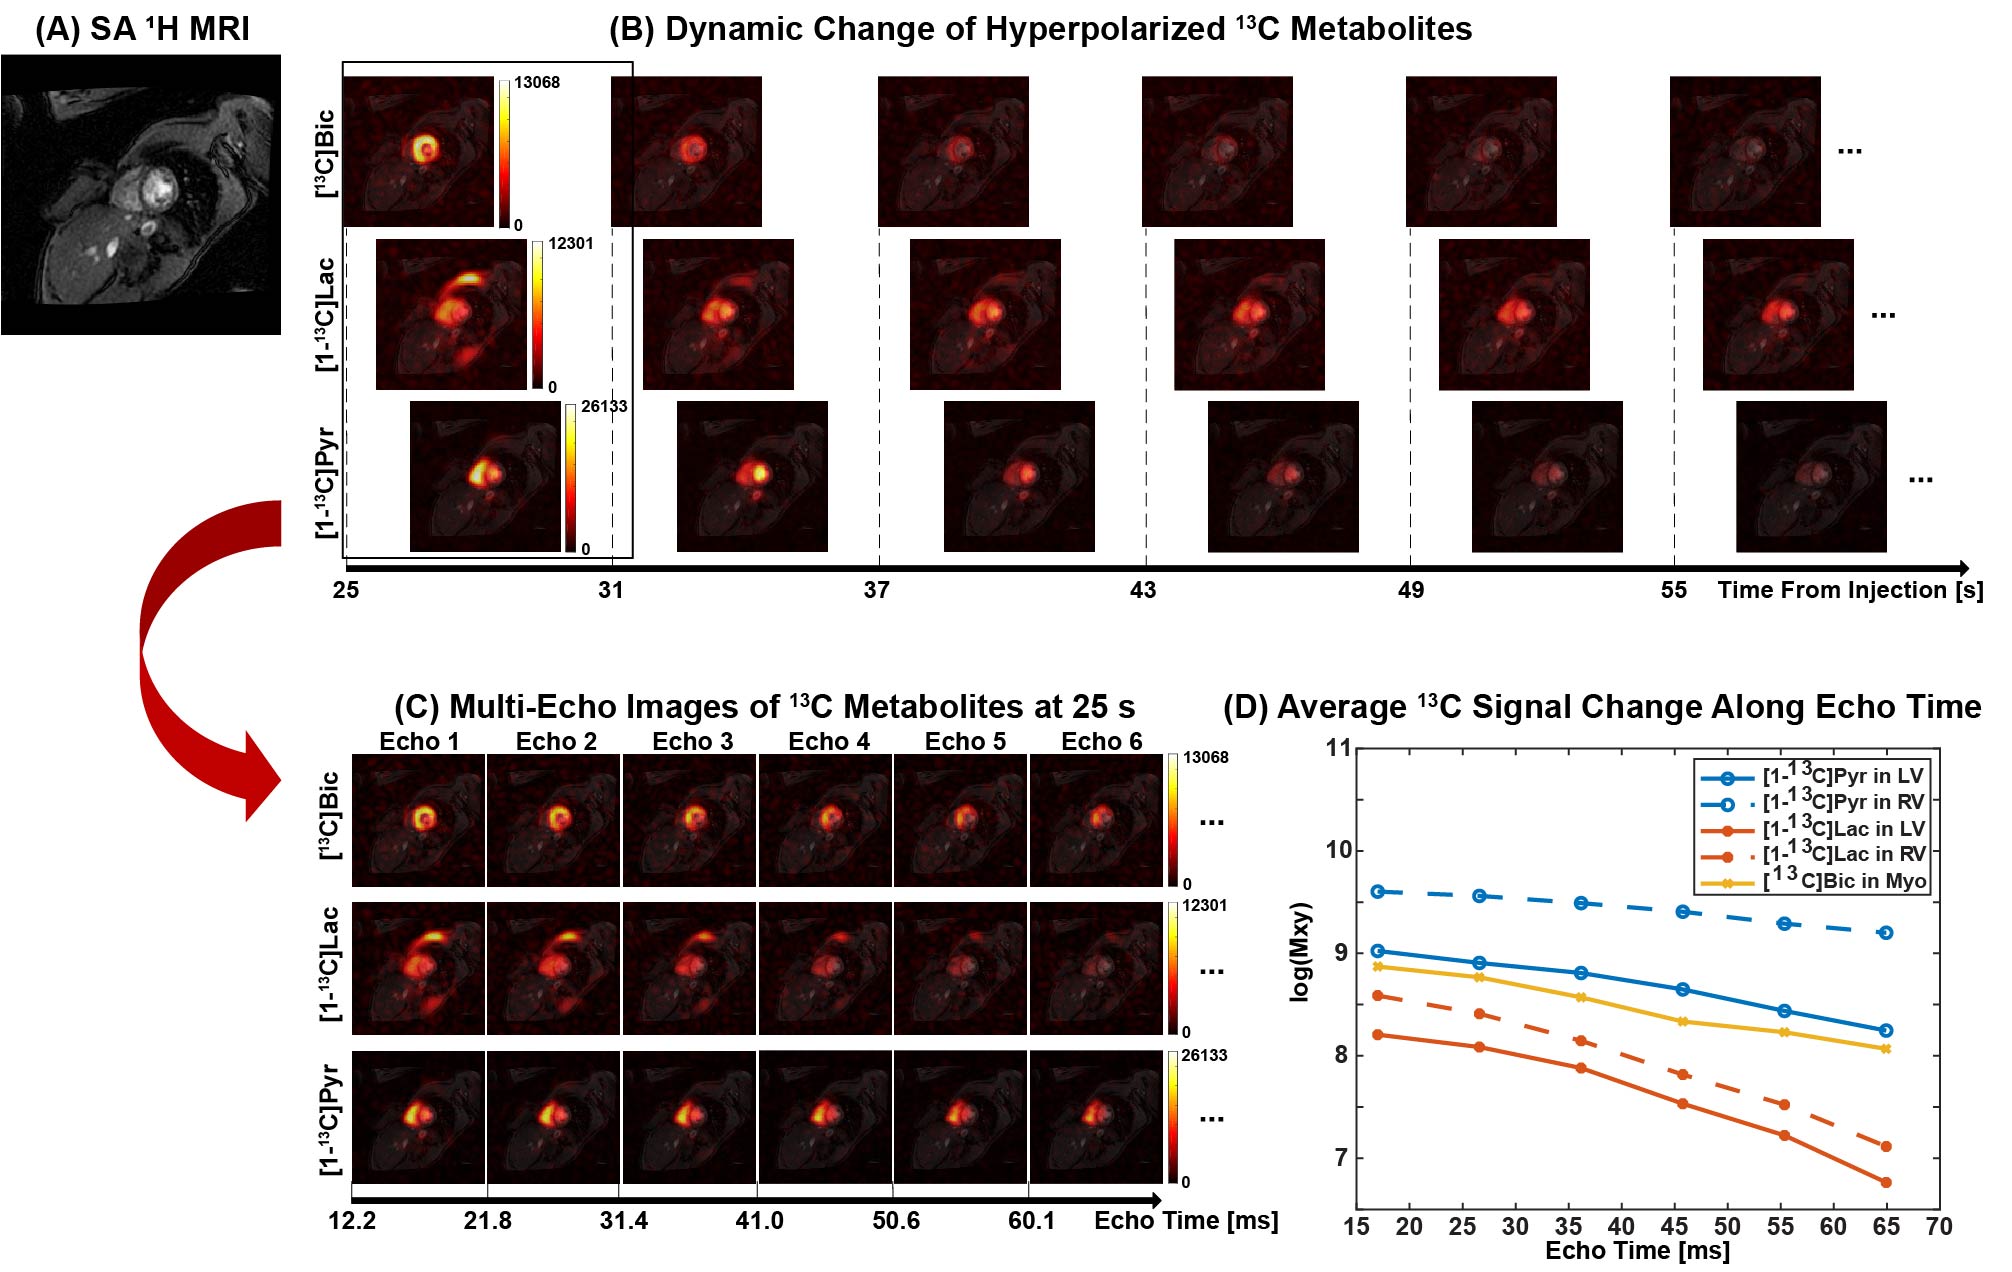
Figure 1. T2* measurement of HP 13C-labeled
metabolites for human heart. (A)
Short-axis 1H MRI of heart from a healthy subject. (B) Dynamic
changes of [13C]bicarbonate, [1-13C]lactate and [1-13C]pyruvate
from 25 s to 55 s after the injection of HP pyruvate. (C) The first 6
echoes acquired at 25 s post the injection for [13C]bicarbonate, [1-13C]lactate
and [1-13C]pyruvate. (D) Changes of 13C signals
within LV, RV and Myo along the echo time in log scale at 25 s post the
injection.
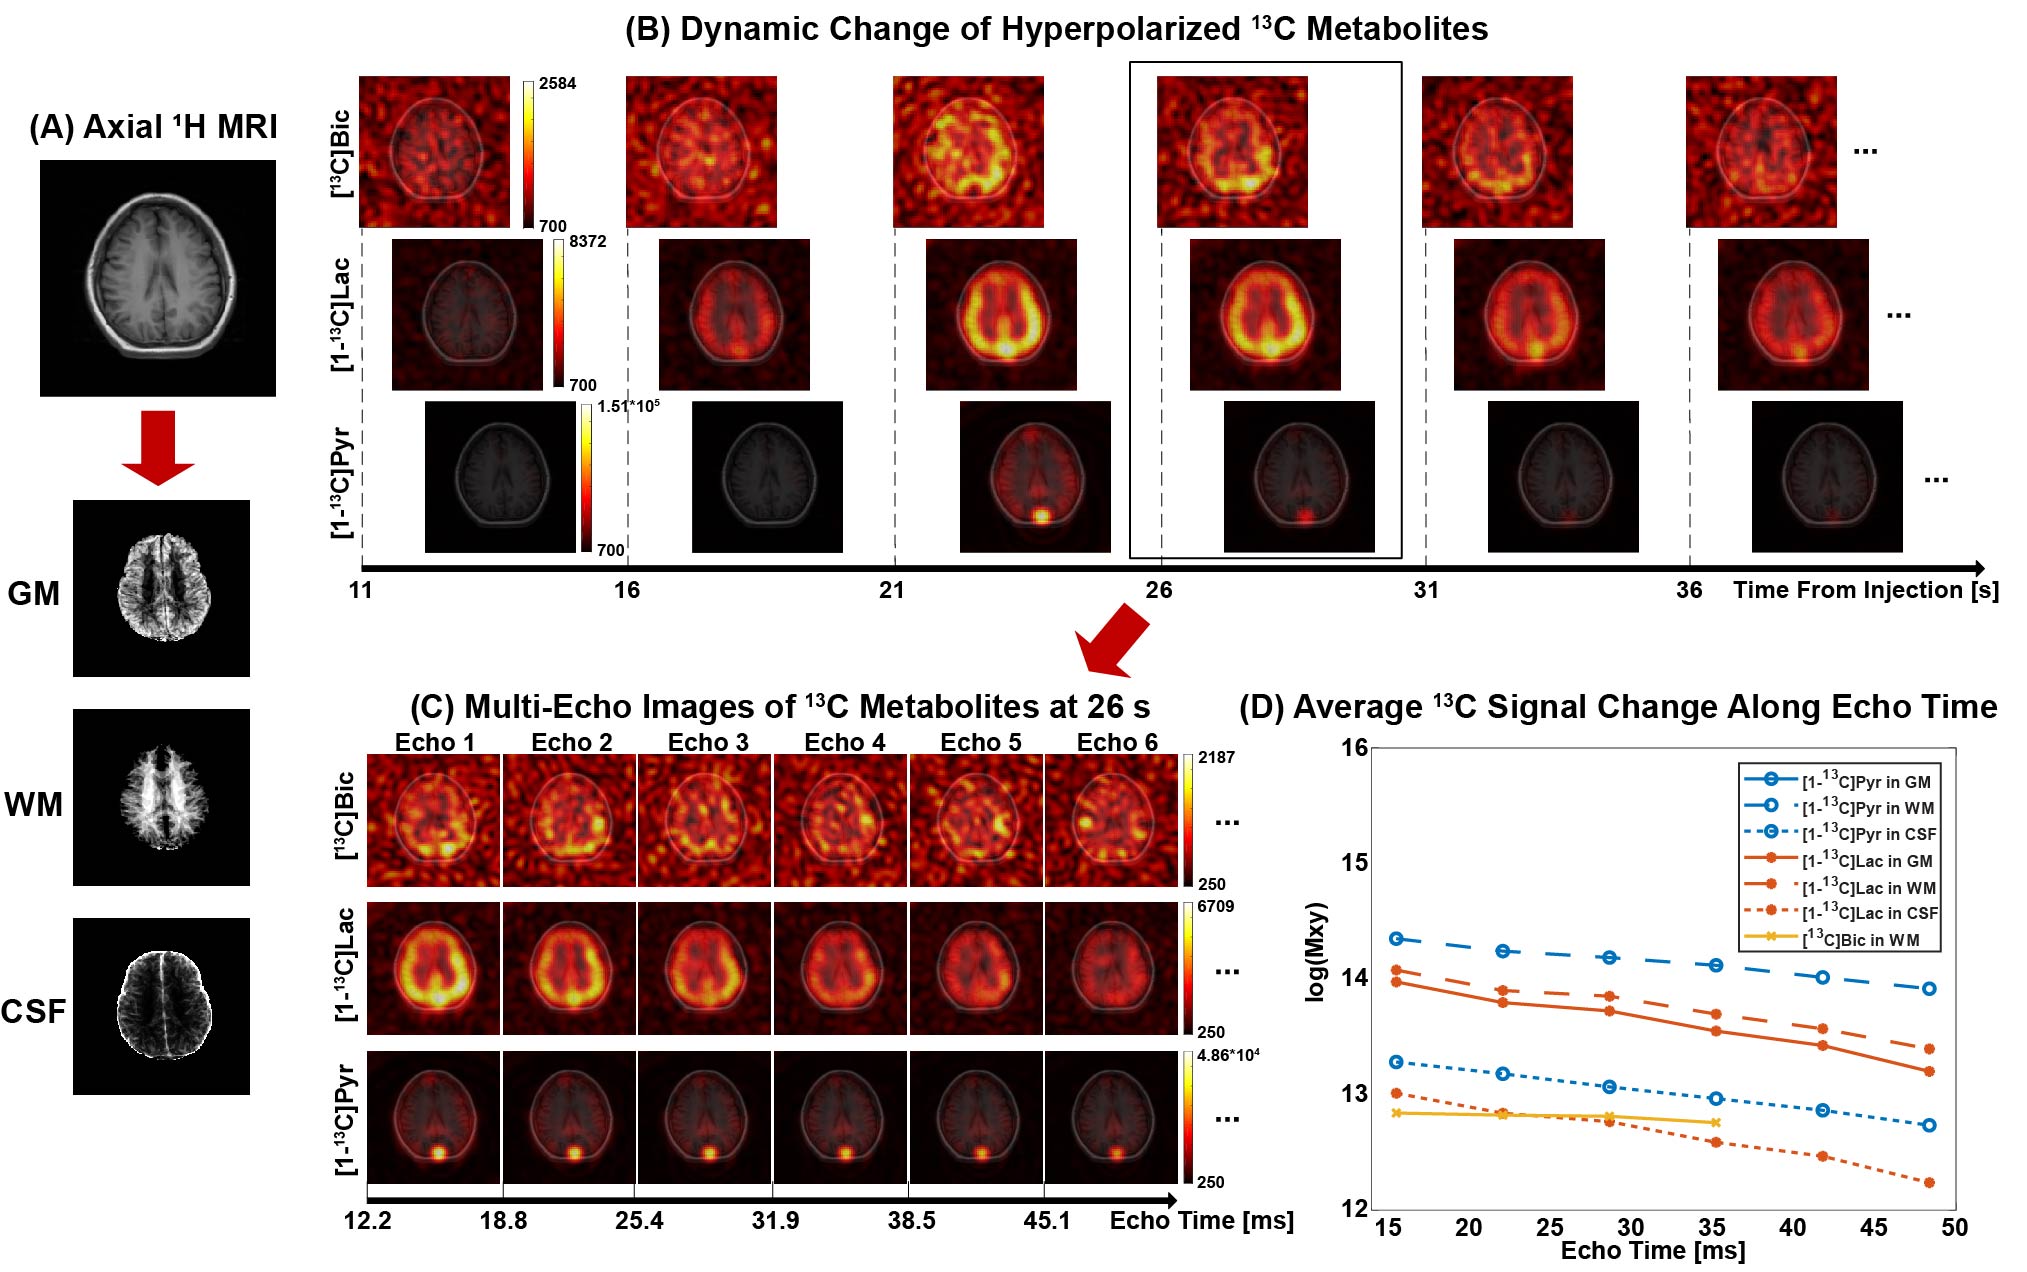
Figure 2. T2* measurement of HP 13C-labeled
metabolites for human brain. (A) Axial
1H MRI of brain from a healthy subject, according to which GM, WM
and CSF were segmented. (B) Dynamic changes of [13C]bicarbonate,
[1-13C]lactate and [1-13C]pyruvate from 11 s to 36 s
after the injection of HP pyruvate. (C) The first 6 echoes acquired at 26
s post the injection for [13C]bicarbonate, [1-13C]lactate
and [1-13C]pyruvate. (D) Changes of 13C signals within
GM, RM and CSF along the echo time in log scale at 26 s post the injection.