Joao Piraquive1, Shubhangi Agarwal1, Robert Bok1, John Kurhanewicz1, Aras Mattis2,3, Jaqueline Maher3,4, Cornelius von Morze5, and Michael A. Ohliger1,3
1Department of Radiology and Biomedical Imaging, University of California San Francisco, University of California San Francisco, San Francisco, CA, United States, 2Department of Pathology, University of California San Francisco, San Francisco, CA, United States, 3Liver center, University of California, San Francisco, CA, United States, 4Department of Medicine, University of California San Francisco, San Francisco, CA, United States, 5Biomedical Magnetic Resonance Laboratory, Washington University School of Medicine, St. Louis, MO, United States
1Department of Radiology and Biomedical Imaging, University of California San Francisco, University of California San Francisco, San Francisco, CA, United States, 2Department of Pathology, University of California San Francisco, San Francisco, CA, United States, 3Liver center, University of California, San Francisco, CA, United States, 4Department of Medicine, University of California San Francisco, San Francisco, CA, United States, 5Biomedical Magnetic Resonance Laboratory, Washington University School of Medicine, St. Louis, MO, United States
We showed important changes in fat signal fraction and pyruvate metabolism in rats fed the MCD diet by using 1H and 13C MR imaging.
Figure
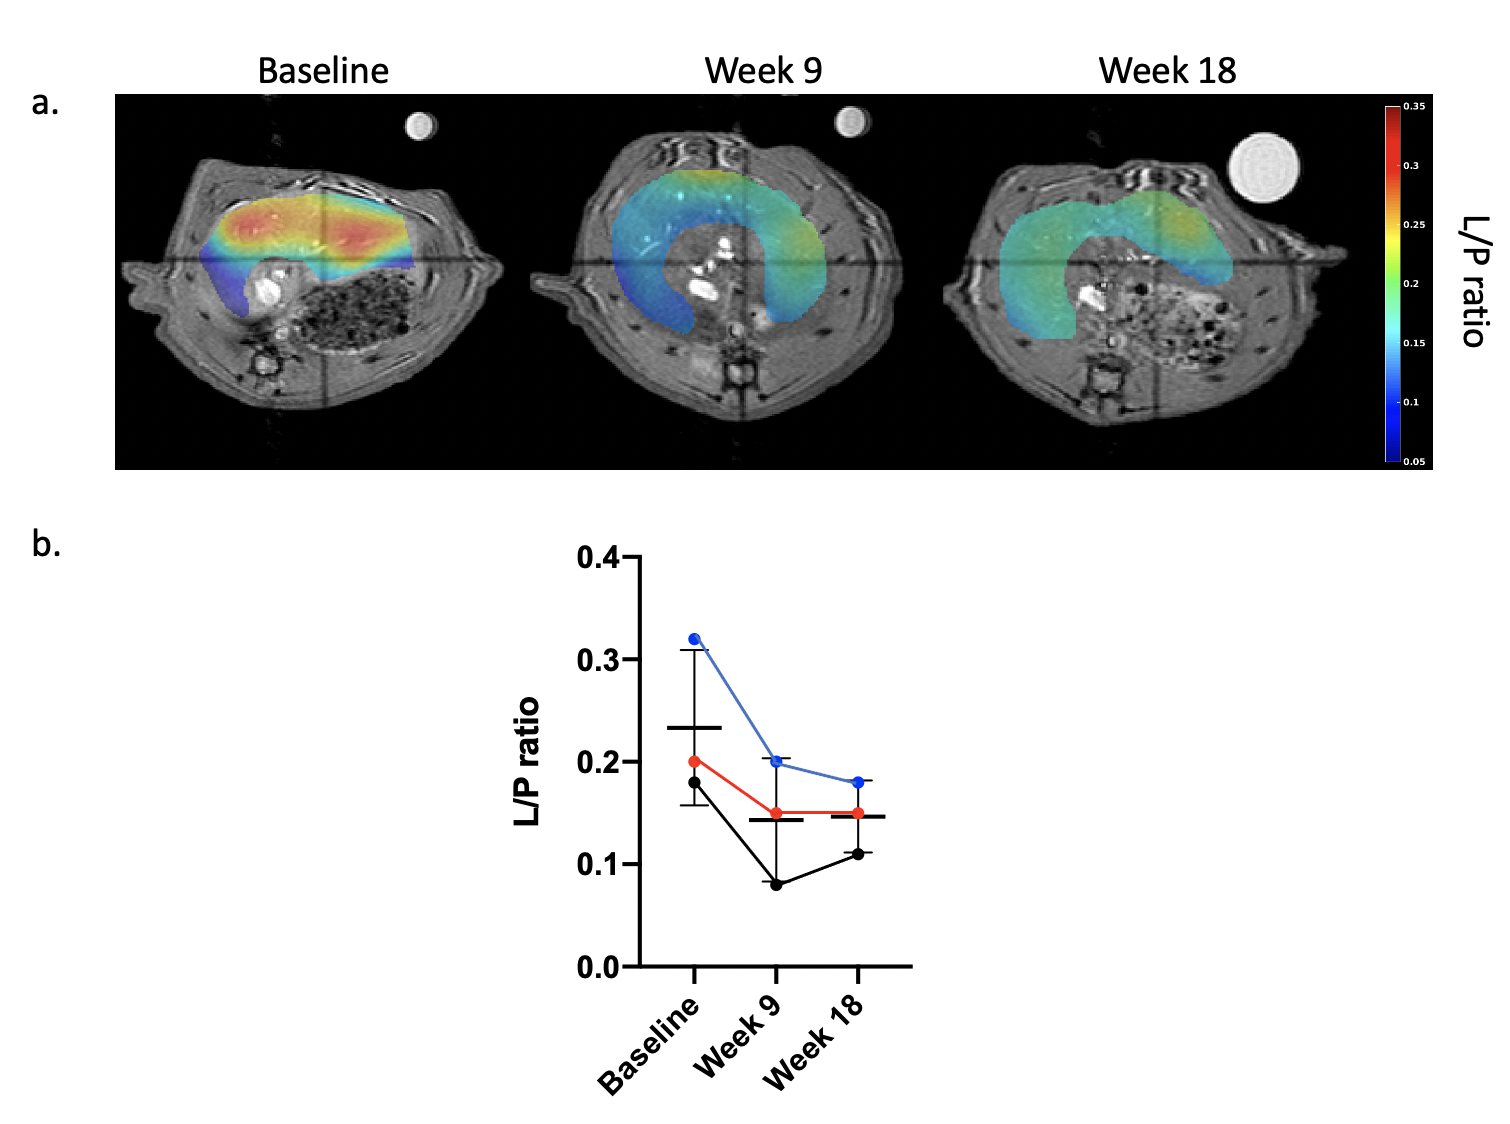
2. Lactate to pyruvate (L/P) ratio maps at baseline, and week 9 and 18 in rats
fed the MCD diet. b) Graph of L/P ratio values at baseline, and week 9 and 18
in rats fed the MCD diet. T-tests were performed to compare changes between time points.
Figure
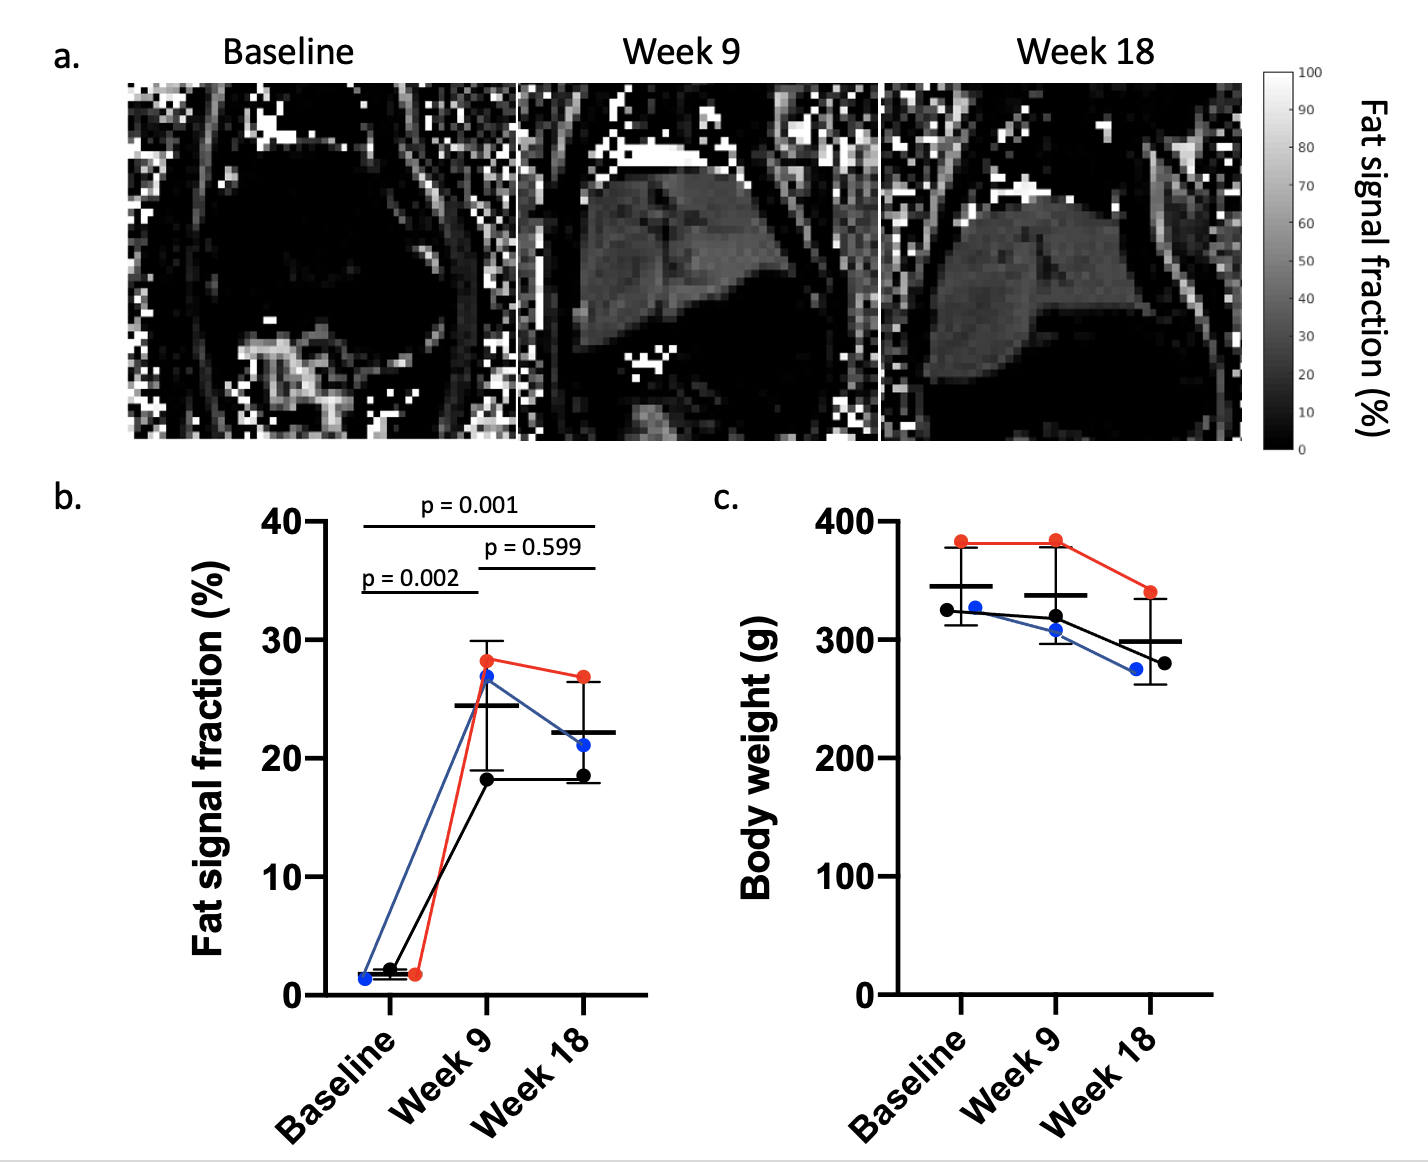
1. Fat signal fraction (FSF) maps at baseline, and week 9 and 18 in rats fed
the MCD diet. b) Graph of FSF values and c) body weight values at baseline, and week 9 and 18 in rats fed
the MCD diet. T-tests were performed to
compare changes between time points.