1Department of Nuclear Medicine, Klinikum rechts der Isar, Technical University of Munich, School of Medicine, Munich, Germany, 2Medizinische Klinik und Poliklinik IV-Campus Großhadern, University Hospital of Munich, Ludwig-Maximilians-University Munich, Munich, Germany, 3Department of Pathology, Klinikum rechts der Isar, Technical University of Munich, Munich, Germany, 4Medizinische Klinik und Poliklinik IV, University Hospital of Munich, Ludwig-Maximilians-University Munich, Munich, Germany, 5Neurosurgical Research University Clinics, Ludwig-Maximilians-University Munich and Walter-Brendel-Centre of Experimental Medicine, Munich, Germany
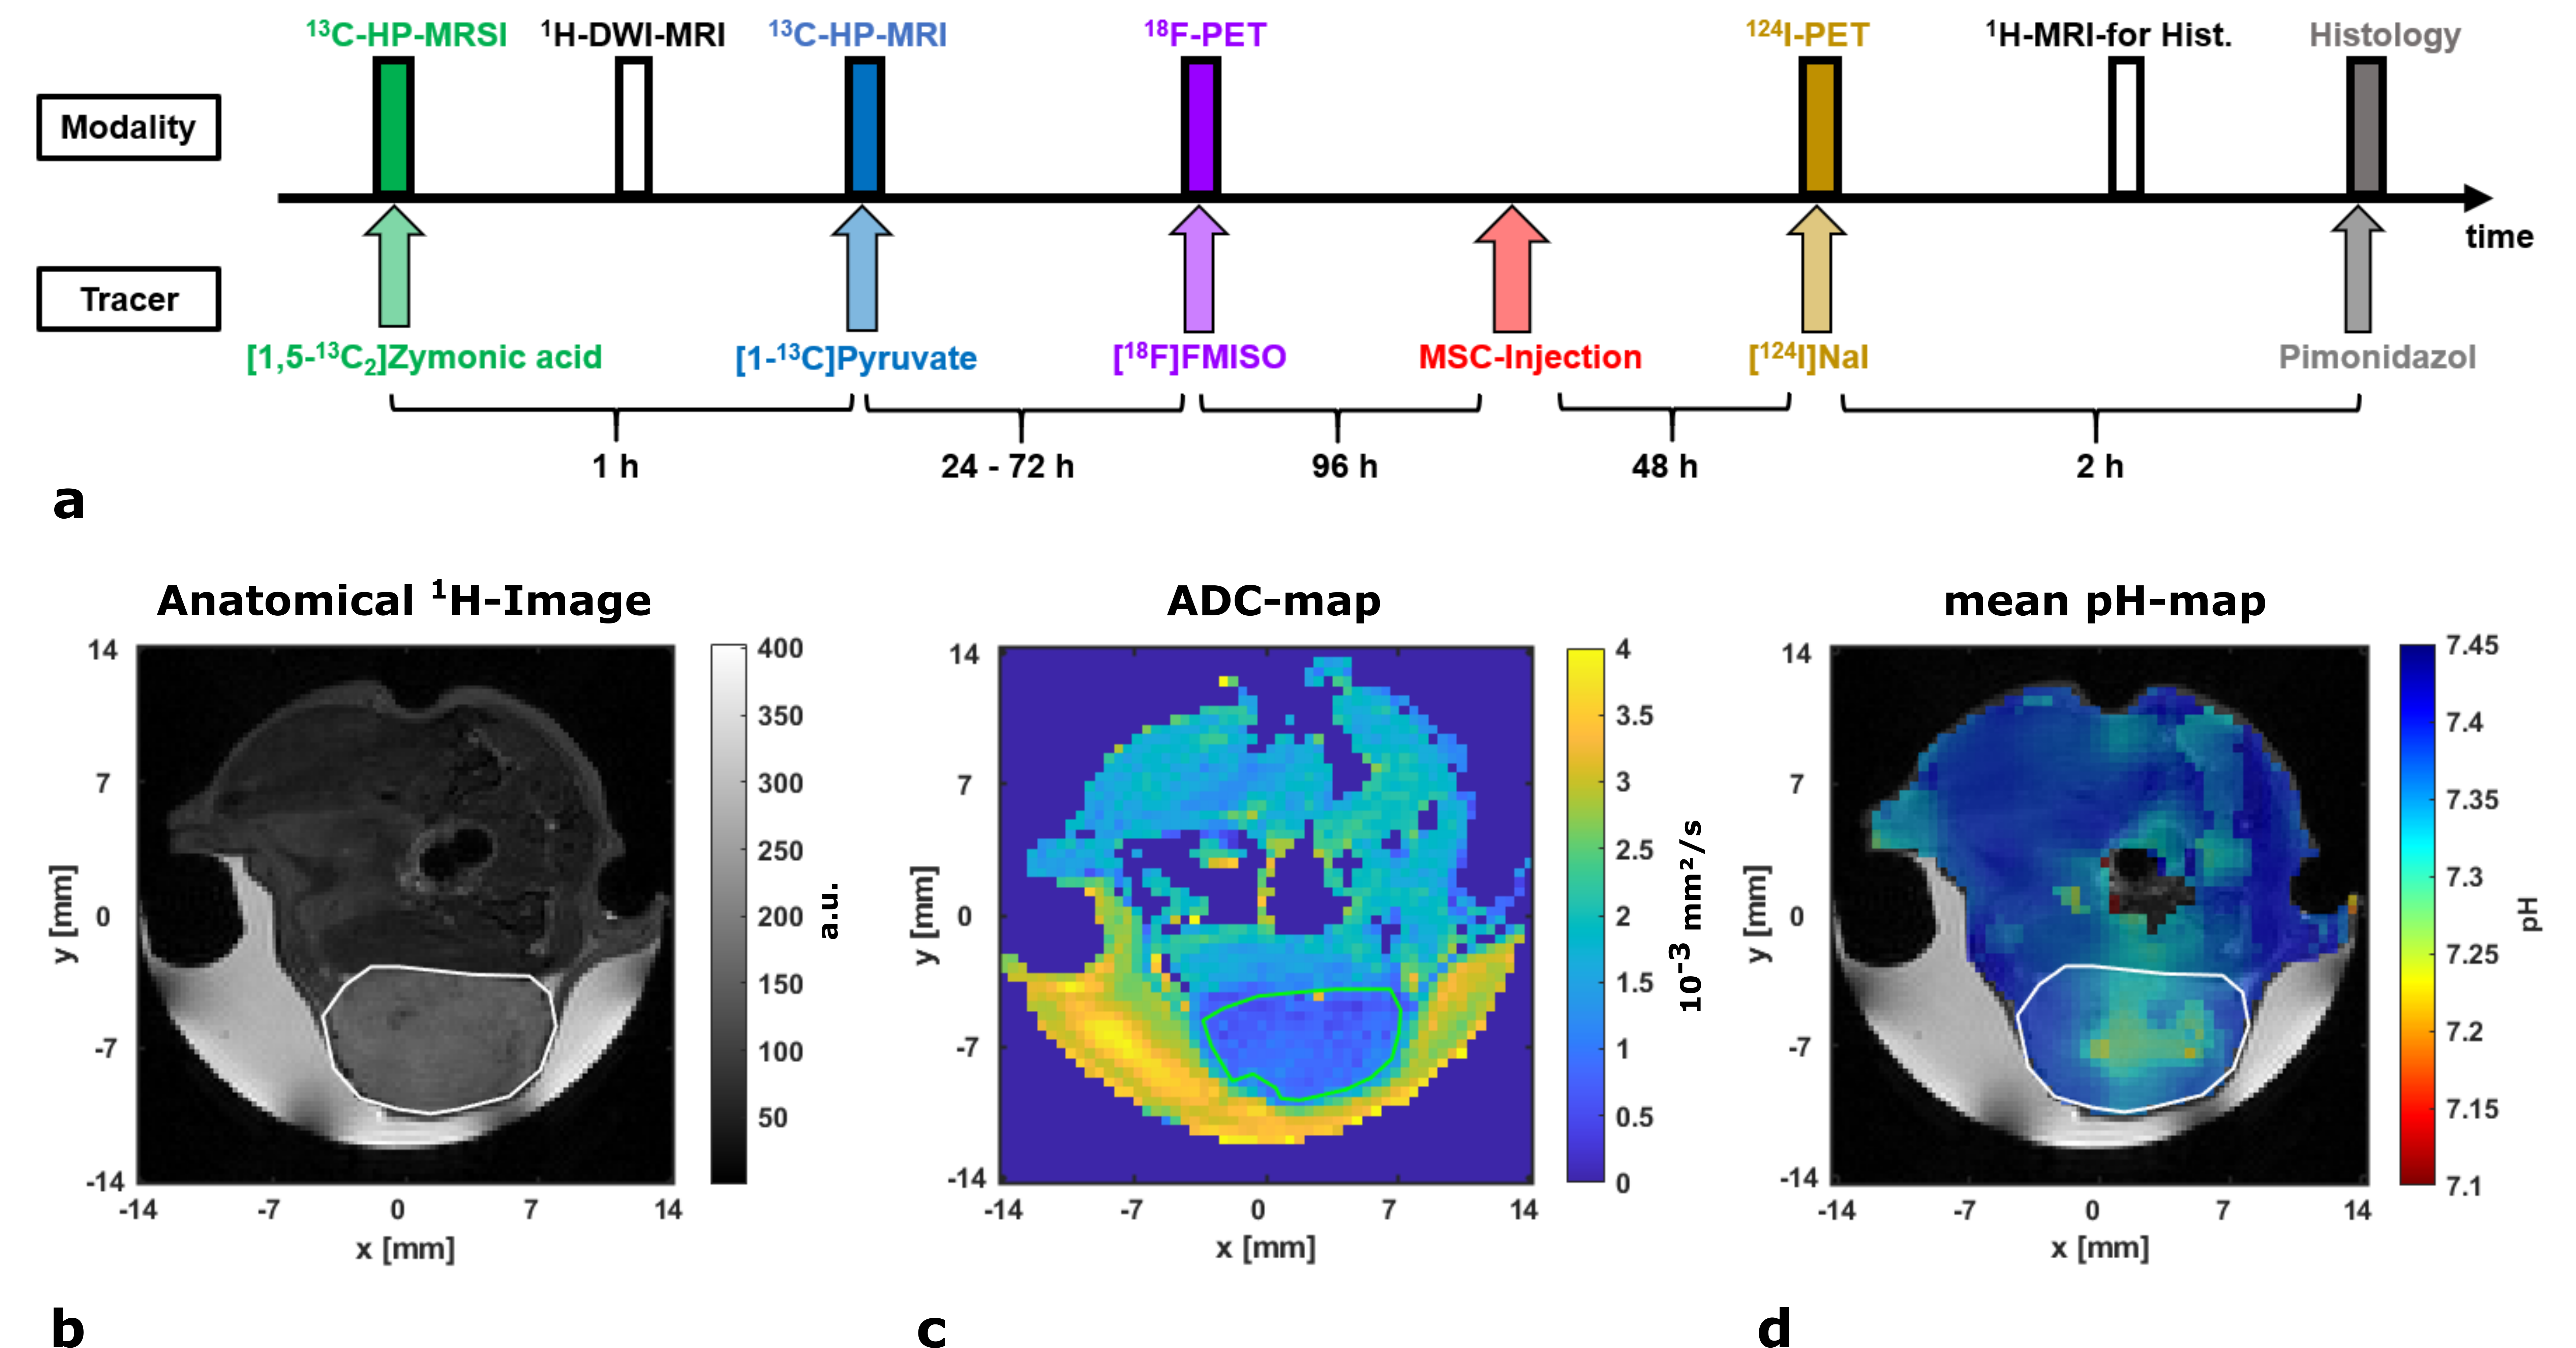
a: Imaging study protocol showing the temporal sequence of the applied modalities and injected tracers.
b: Axial anatomical T2-weighted 1H-RARE-image of a mouse bearing a subcutaneous GBM2-tumor (ROI encircled by white line) and Gd‑doped [1-13C]lactate-phantom (white arrow) covered by gel.
c: ADC-map showing the fitted diffusion coefficients based on 16 b-value images.
d: Mean pH-map weighted by compartment-intensities in the corresponding voxel overlaid with anatomical image.
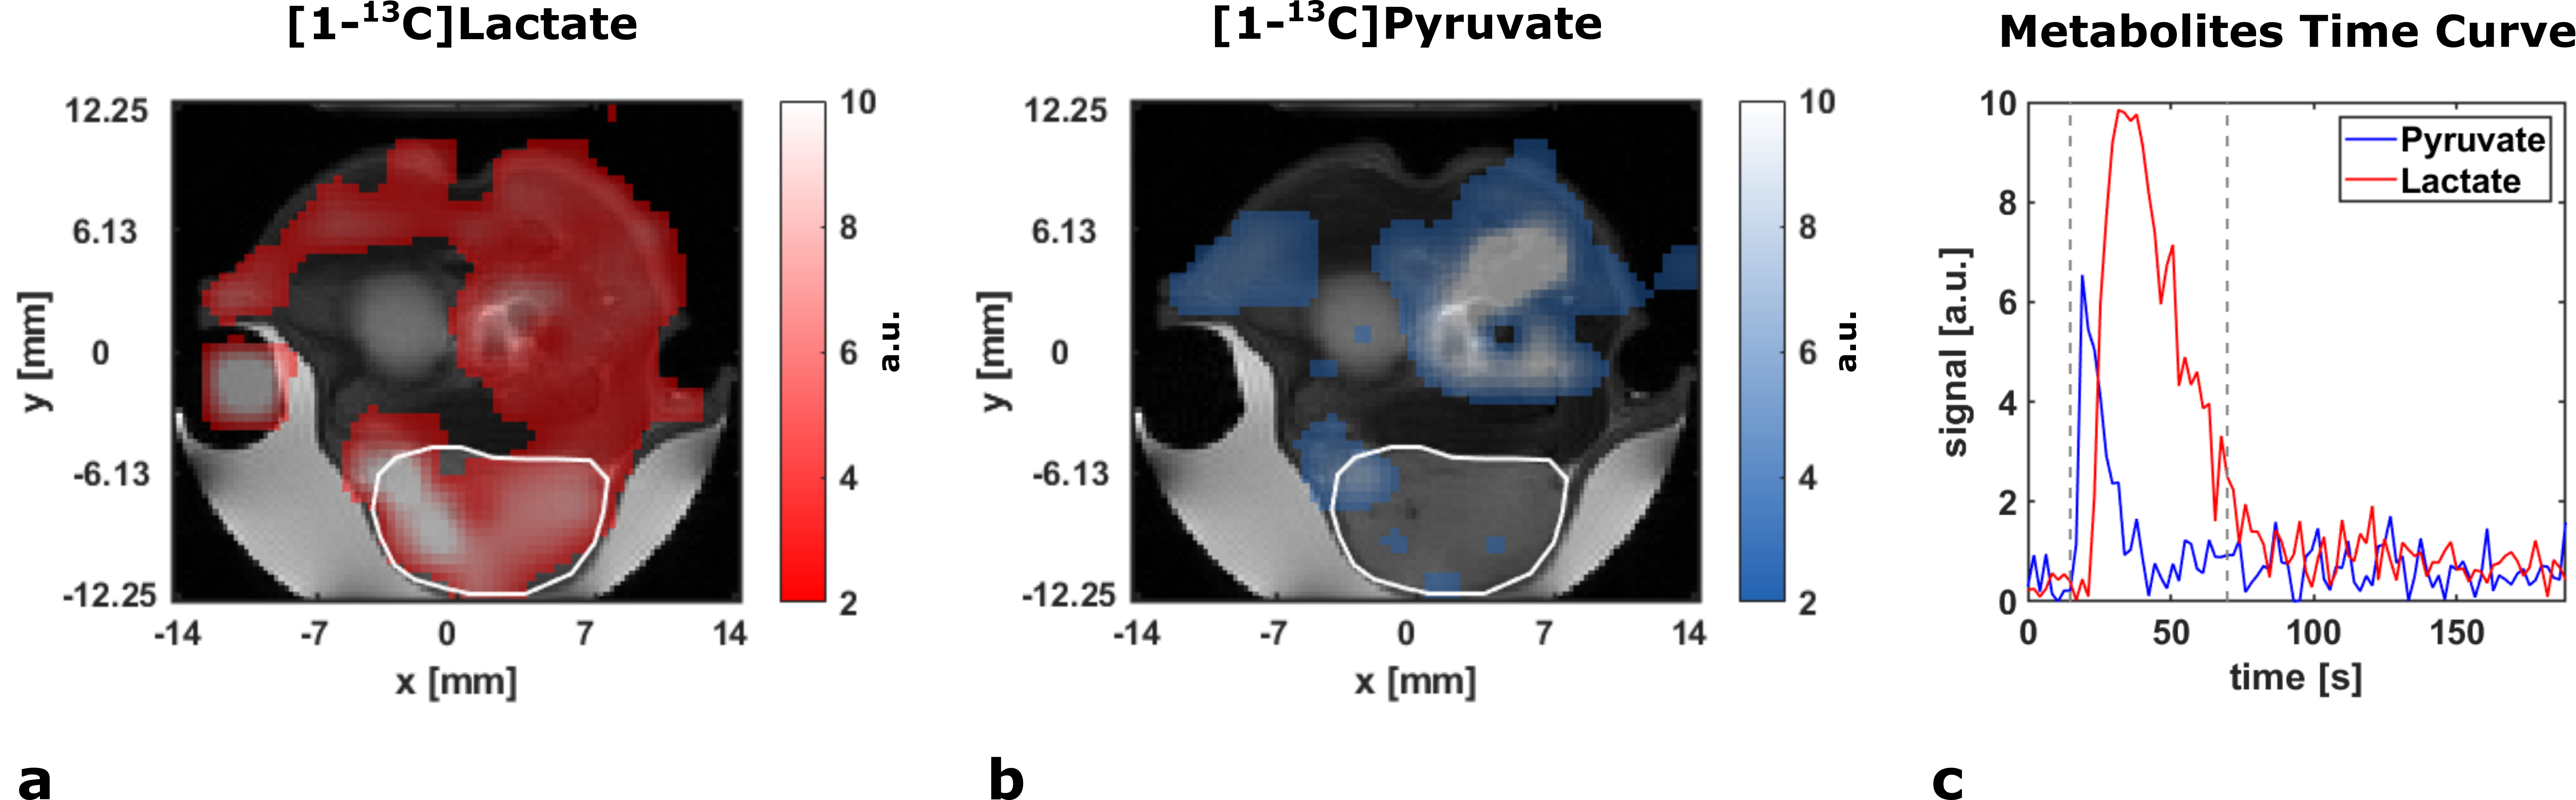
a: Axial [1-13C]lactate intensity image integrated over the range displayed in c overlaid with an anatomical image.
b: Axial [1-13C]pyruvate intensity image integrated over the range displayed in c overlaid with an anatomical image.
c: Signal time curves for [1-13C]pyruvate (blue) and [1-13C]lactate (red) with a 3D tumor ROI. Integration ranges for intensity images in a and b are displayed with dashed lines.