Rosh Varghese Georgy1, Elizabeth Joseph1, Aparna Irodi1, Binita Riya Chacko1, Leena Vimala Robinson1, and Roshan Samuel Livingstone1
1Department of Radiology, Christian Medical College, Vellore, India
1Department of Radiology, Christian Medical College, Vellore, India
T1, T2 mapping showed a strong positive correlation with T2*
and T1 was shown to be superior to T2 in the non-invasive assessment of cardiac
iron overload. 30% of the study population had normal T2* values, but low T1
values - an interesting finding.
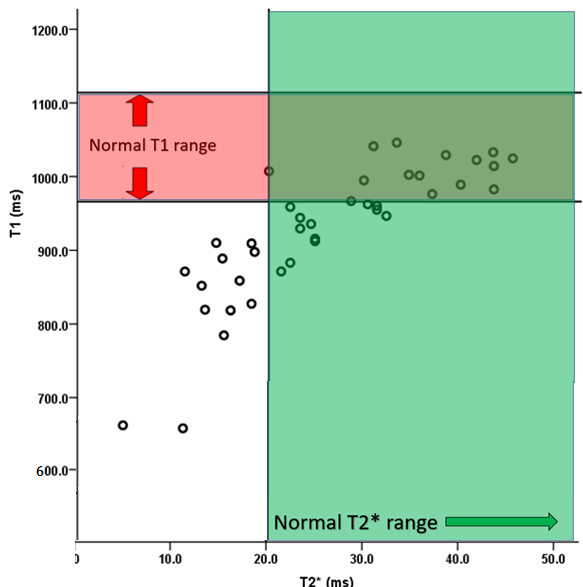
Figure 4 - 12 patients (30%) out of the total 40 patients showed T1
value below the normal range (<966ms), despite having T2* value in the
normal range (>20ms)
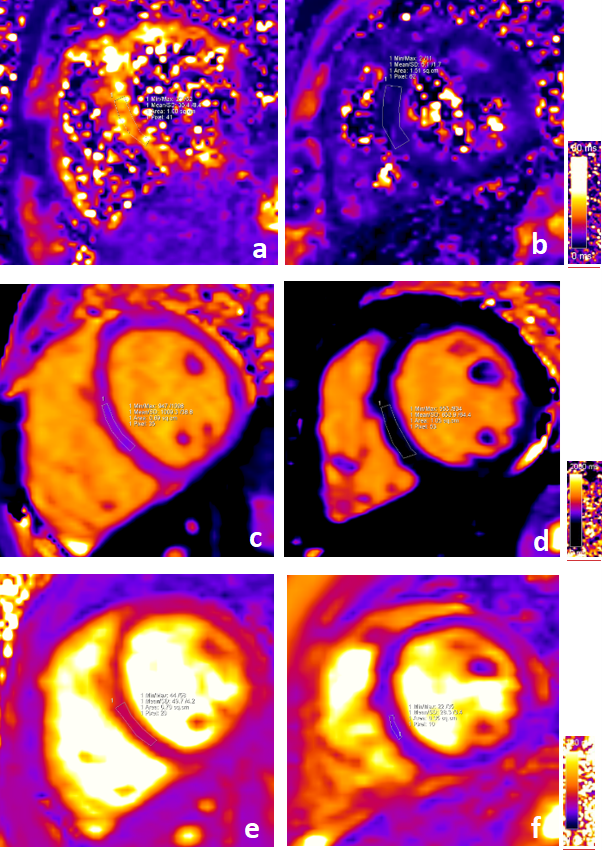
Figure 1 – T2* colour map in a normal patient (A) and a
patient with severe cardiac iron overload (B). T1 colour map in a normal
patient (C) and a patient with severe cardiac iron overload (D). T2 colour map
in a normal patient (E) and a patient with severe cardiac iron overload (F)