Habib Rebbah1, Anaïs Bernard1, Julien Rouyer1, and Timothé Boutelier1
1Department of Research & Innovation, Olea Medical, La Ciotat, France
1Department of Research & Innovation, Olea Medical, La Ciotat, France
The
myocardial ECV compute after the registration of pre- and post-injection was
significantly different than the ECV obtained by manual segmentation of
structures. However, the bias remained thin (<1%/3% for remote/infarct).
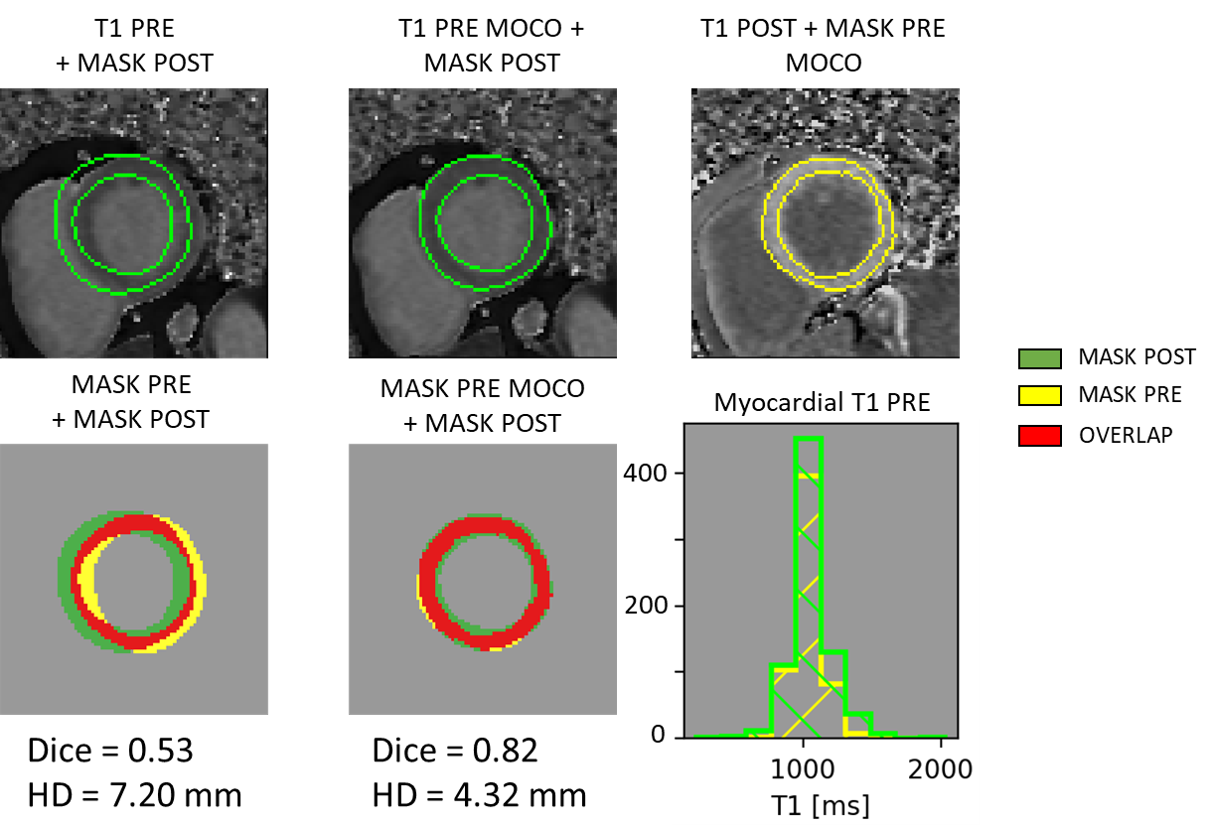
Registration
result. The green contours and bars refer to the post-injection T1 map mask and
the yellow one to the pre-T1 map mask. The second row presents the overlap (in
red) of the masks before (1st column) and after (2nd
column) Moco. The histogram plot shows the distribution of the pre-T1 values in
the mask defined on the pre-T1 map before registration (yellow) and the
distribution of the pre-T1 values in the mask defined on the post-T1 map after
registration (green). HD: Hausdorff Distance.
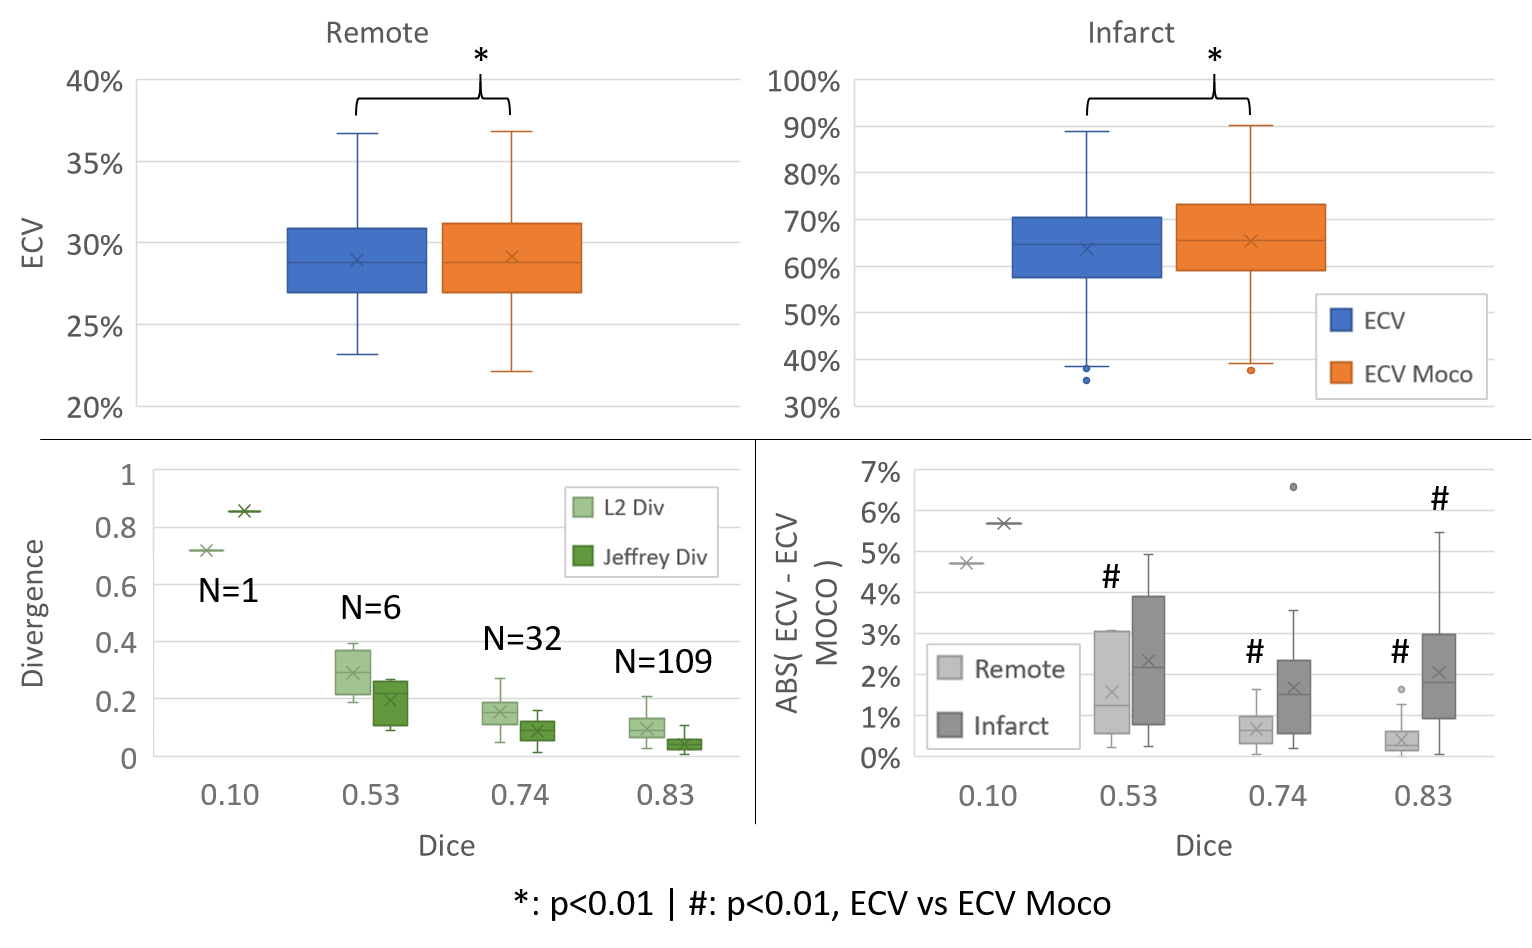
Global
results. The 1st row presents the results in term of ECV for the
remote (left) and infarct part (right), and for manual computed ECV (blue) and
registration-based computation of ECV (orange). The divergence plot shows the
difference between the distribution of pre-T1 value of the myocardium before
and after registration in term of L2 distance and Jeffrey’s divergence. The final
plot represents the difference between manual and Moco ECV regarding the
obtained Dice after registration.