Maryam Afzali1, Hans Knutsson2,3, Evren Özarslan2,3,4, and Derek K Jones1,5
1Cardiff University Brain Research Imaging Centre (CUBRIC), School of Psychology, Cardiff University, Cardiff, United Kingdom, 2Department of Biomedical Engineering, Linköping University, Linköping, Sweden, 3Center for Medical Image Science and Visualization, Linköping University, Linköping, Sweden, 4These authors share last authorship, Linköping, Sweden, 5These authors share last authorship, Cardiff, United Kingdom
1Cardiff University Brain Research Imaging Centre (CUBRIC), School of Psychology, Cardiff University, Cardiff, United Kingdom, 2Department of Biomedical Engineering, Linköping University, Linköping, Sweden, 3Center for Medical Image Science and Visualization, Linköping University, Linköping, Sweden, 4These authors share last authorship, Linköping, Sweden, 5These authors share last authorship, Cardiff, United Kingdom
Orientationally-averaged diffusion-weighted signal can be computed using arithmetic averaging, weighted signal averaging; spherical harmonic; and Mean Apparent Propagator MRI (MAP-MRI) are compared. At low SNR and low number of data points MAP based approaches are better than the others.
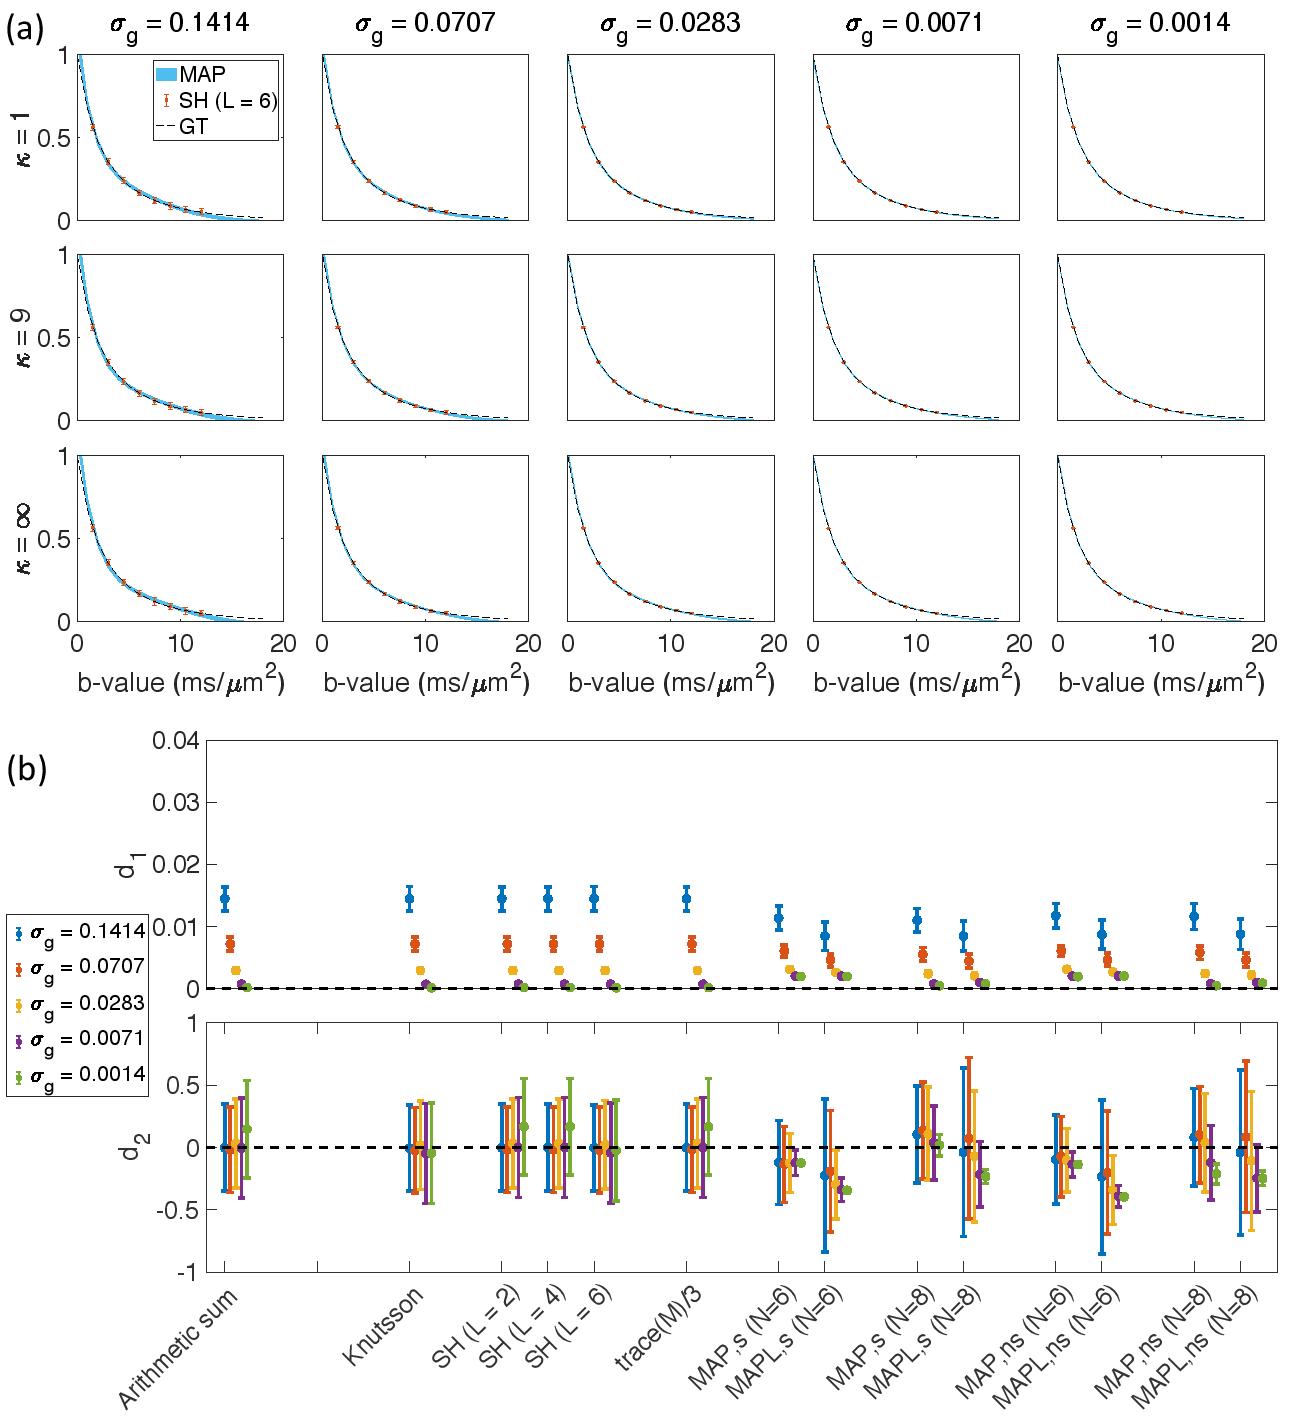
Fig. 1. The results from 488 samples for both shelled (61×8) and non-shelled point sets 18 in the presence of Gaussian noise. (a) the mean and std of the estimated signal versus b-value using MAP-MRI method with Nmax = 6 for five different noise floors, σg, and three different dispersion values, κ. The thickness of the blue band is twice the standard deviation of the signal estimates and its center is the mean. The dashed black line shows the ground truth and the red dots and bars show the results of the SH (L = 6). (b) the mean and std of the d1 and d2 measures for different methods.
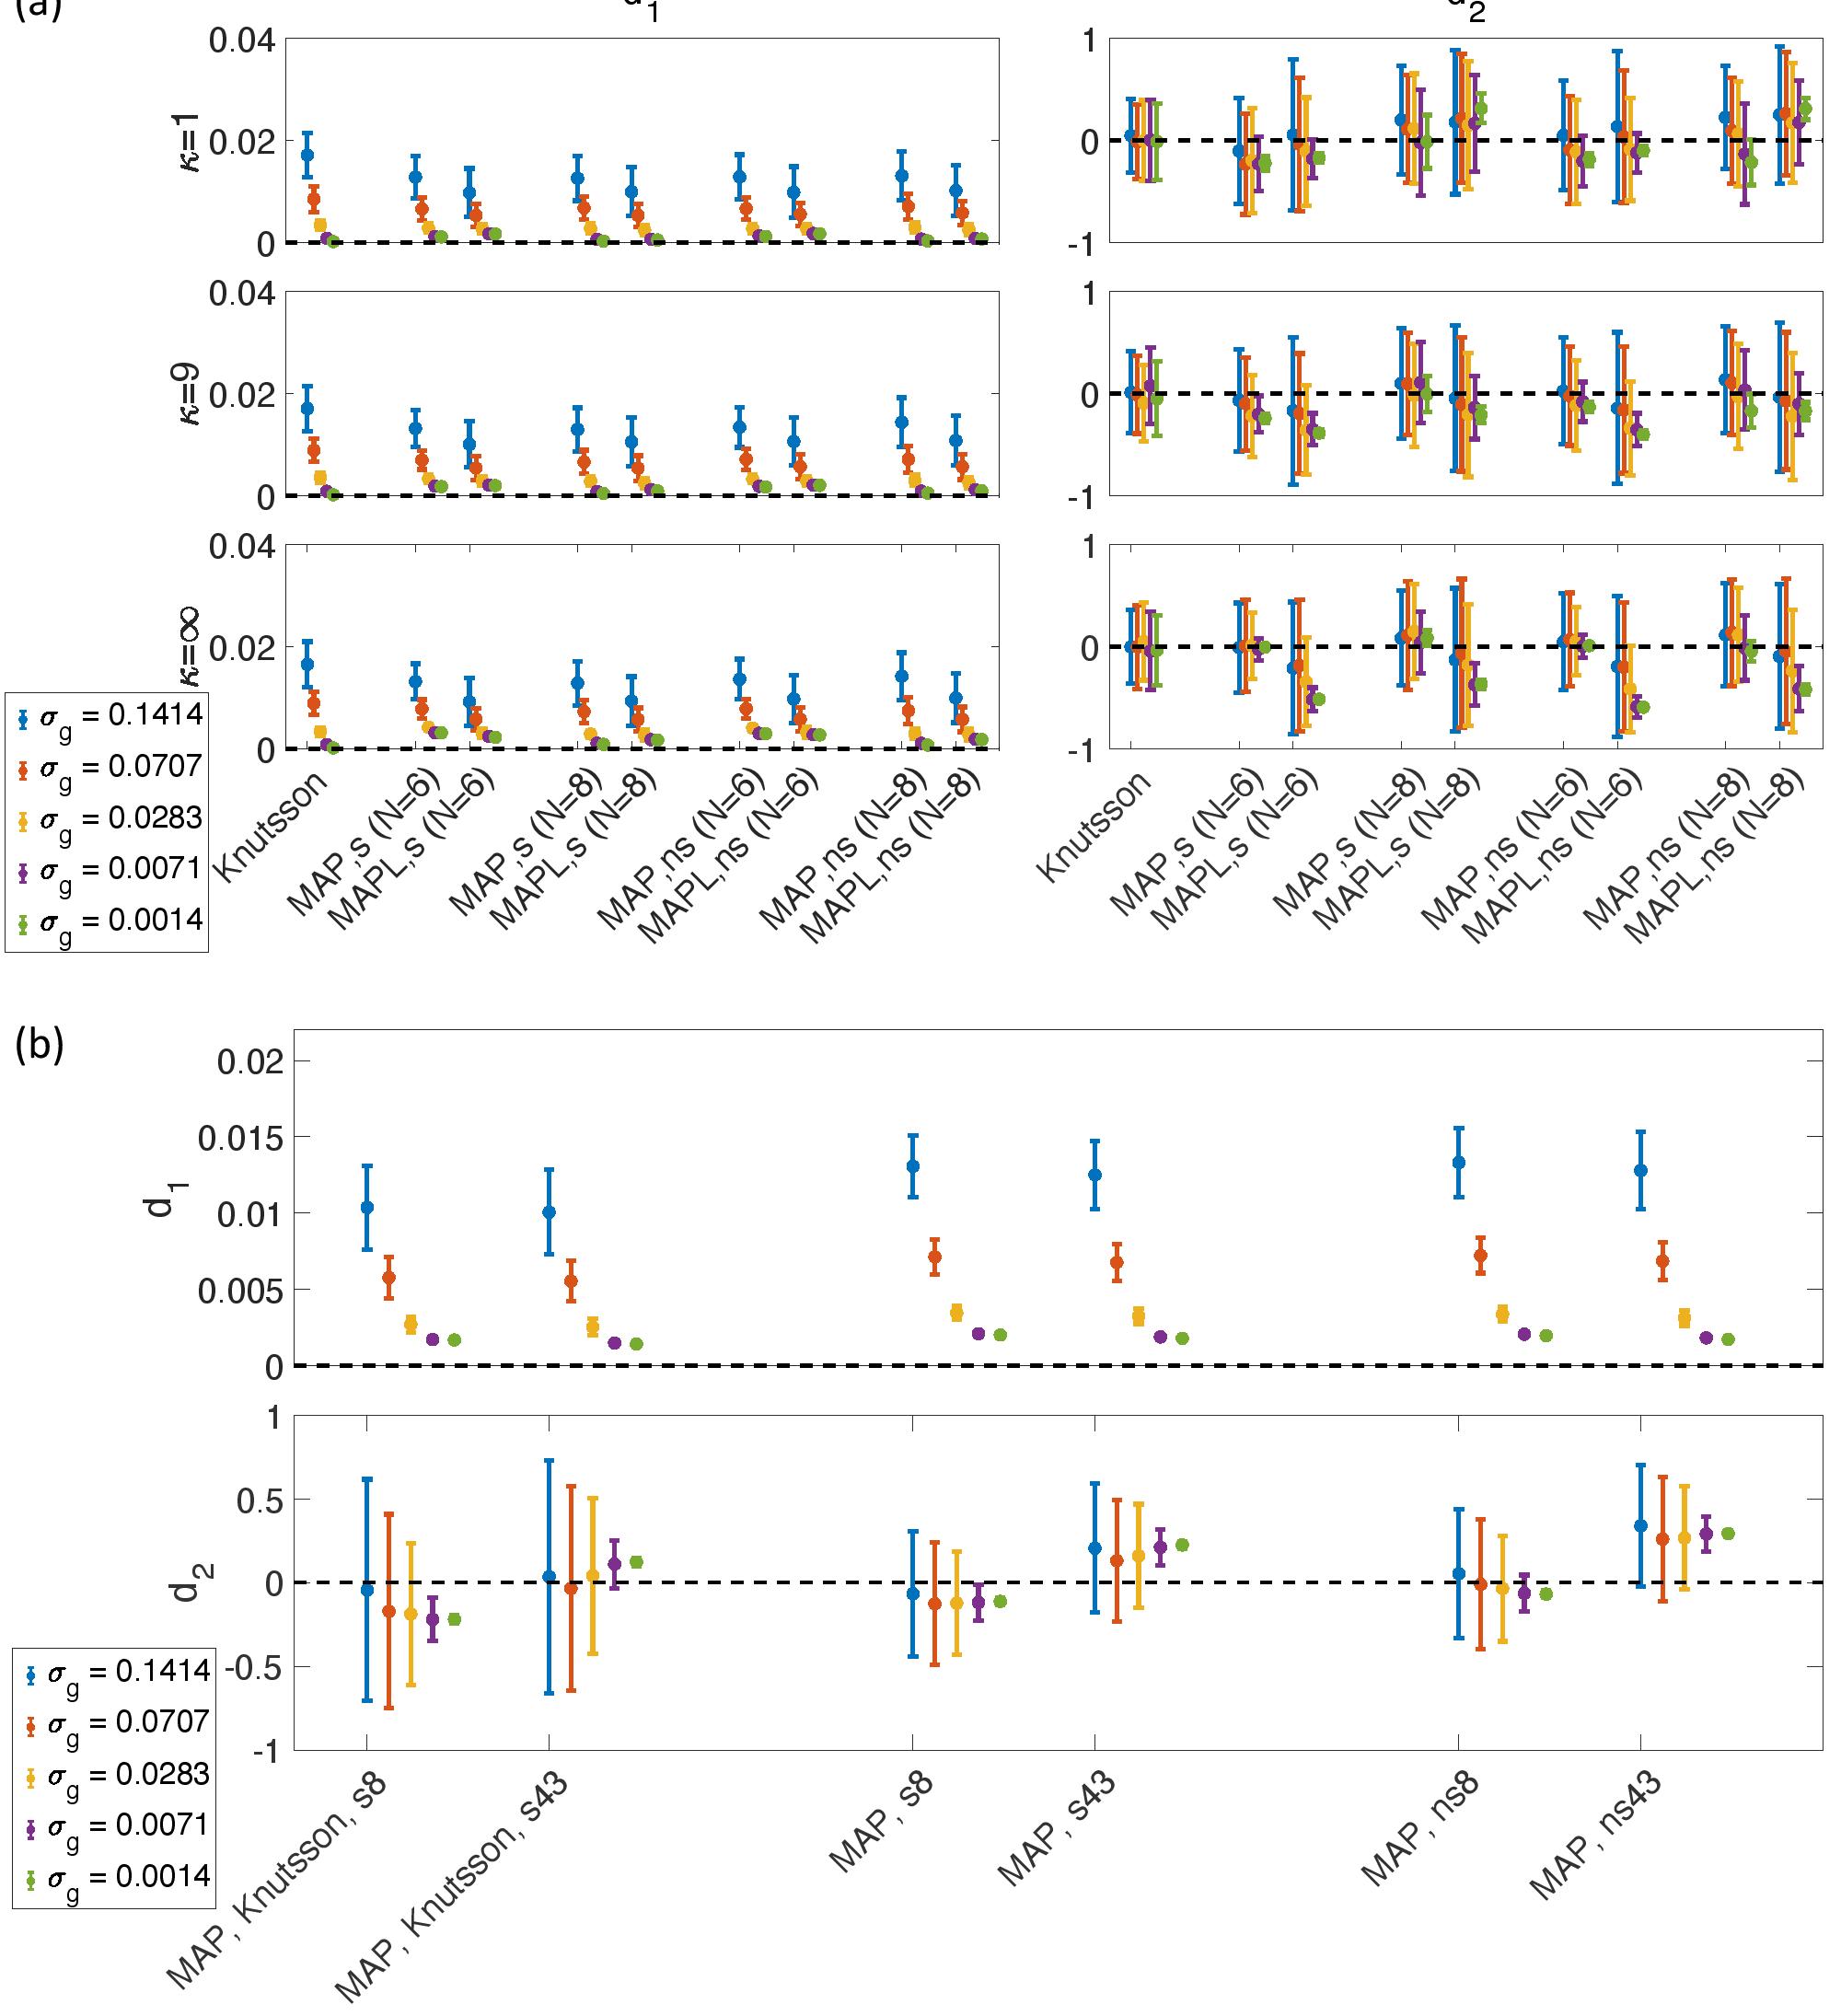
Fig. 5. (a) the estimated d1 and d2 for three different κ values, 344 (43×8) point sets in the presence of five different Gaussian noise levels. (b) the results of MAP-based interpolation of the orientationally-averaged data from Knutsson method (`MAP, Knutsson, s8' and `MAP, Knutsson, s43') on 43×8 shelled Lebedev 25 and the interpolation of original data (before averaging) on shelled (`MAP, s8' and `MAP, s43') and non-shelled point sets (`MAP, ns8' and `MAP, ns43') 18.