Xin Li1, Eric M. Baker1, Brendan Moloney1, Cory Wyatt1, Eric Baetscher1, Erin W. Gilbert2, Charles S. Springer1, Alexander R. Guimaraes1,3, and William D. Rooney1
1Advanced Imaging Research Center, Oregon Health & Science University, Portland, OR, United States, 2Surgery, Oregon Health & Science University, Portland, OR, United States, 3Diagnostic Radiology, Oregon Health & Science University, Portland, OR, United States
1Advanced Imaging Research Center, Oregon Health & Science University, Portland, OR, United States, 2Surgery, Oregon Health & Science University, Portland, OR, United States, 3Diagnostic Radiology, Oregon Health & Science University, Portland, OR, United States
Using seven b-value acquisitions as an
example, the optimal maximum DWI b-value for pancreas tail tissue is found to
be generally under 3,000 s/mm2.
Evenly-spaced b-value strategies are often sufficient.
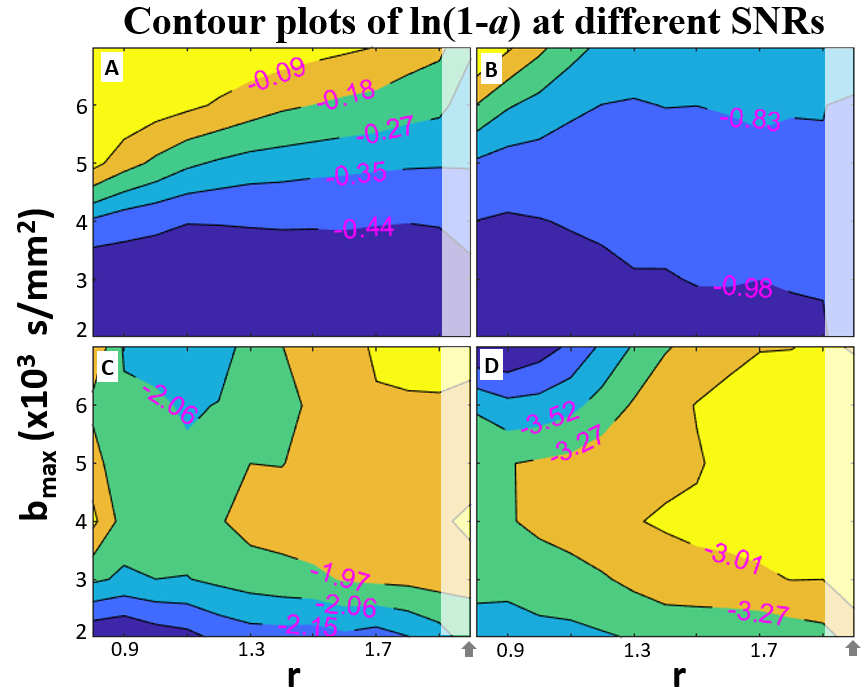
Figure 3. Contour plots of ln (1- a) for different bmax (from 2,000 to 7,000) and
different b-spacing power (r) values for four different SNRs (single real or
imaginary channel) of 50 (A), 100 (B), 200 (C), 300 (D). The log spacing option (gray arrows) was
appended to the far right to the r values in each panel with white shading for
differentiation. For normal pancreatic
tail tissue, a bmax under 3000 s/mm2 is sufficient for
practical achievable SNR and even b-spacing pattern is often among the optimal choices. See Fig. 4 for more details.
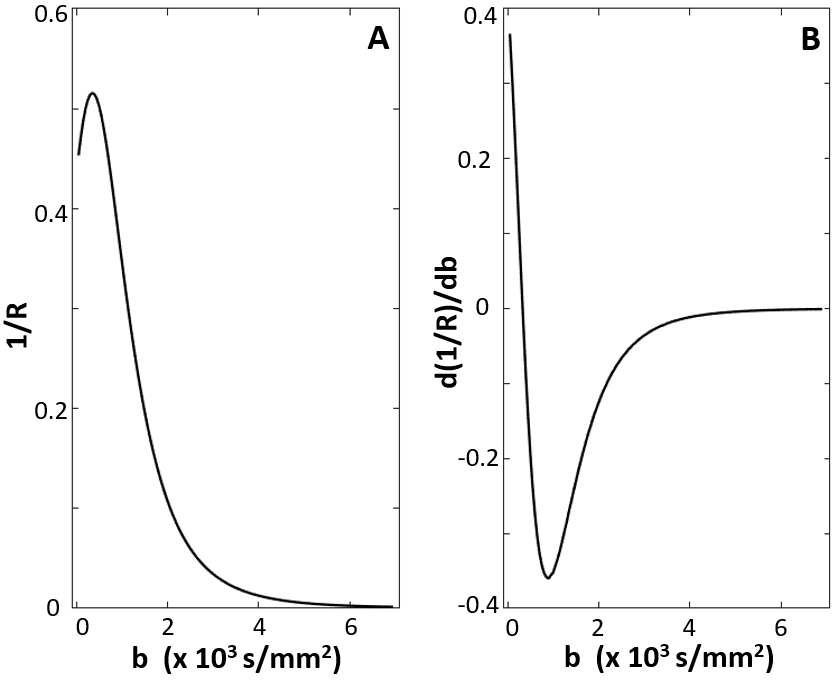
Figure 4. The numerically determined radius
(R) of curvature reciprocal for the “true” DWI curve (Fig. 1 solid curve) is plotted
against the b-values in panel A. When 1/R approaches zero, the b-space decay
approaches a straight line. Panel B
plots the derivative of (1/R) with respect to b. It quantifies how quickly the curvature
in panel A changes with respective
to b. For this case, the most dramatic
change occurs when b < 3,000 s/mm2, matching the Fig. 3
simulation results. (The ordinate units
are not given.)