Leonardino A. Digma1, Christine H. Feng1, Christopher C. Conlin2, Ana E. Rodriguez-Soto2, Kanha Batra3, Aaron Simon1, Roshan Karunamuni1, Joshua Kuperman2, Rebecca Rakow-Penner2, Michael E. Hahn2, Anders M. Dale2, and Tyler M. Seibert1,4
1Department of Radiation Medicine and Applied Sciences, UCSD School of Medicine, La Jolla, CA, United States, 2Department of Radiology, UCSD School of Medicine, La Jolla, CA, United States, 3Department of Electrical and Computer Engineering, UC San Diego, La Jolla, CA, United States, 4Department of Bioengineering, UC San Diego, La Jolla, CA, United States
1Department of Radiation Medicine and Applied Sciences, UCSD School of Medicine, La Jolla, CA, United States, 2Department of Radiology, UCSD School of Medicine, La Jolla, CA, United States, 3Department of Electrical and Computer Engineering, UC San Diego, La Jolla, CA, United States, 4Department of Bioengineering, UC San Diego, La Jolla, CA, United States
In this work, we demonstrate that DWI of bone metastases undergo spatial distortions due to static magnetic field inhomogeneities. We also show that these distortions can be efficiently corrected using the reverse polarity gradient technique.
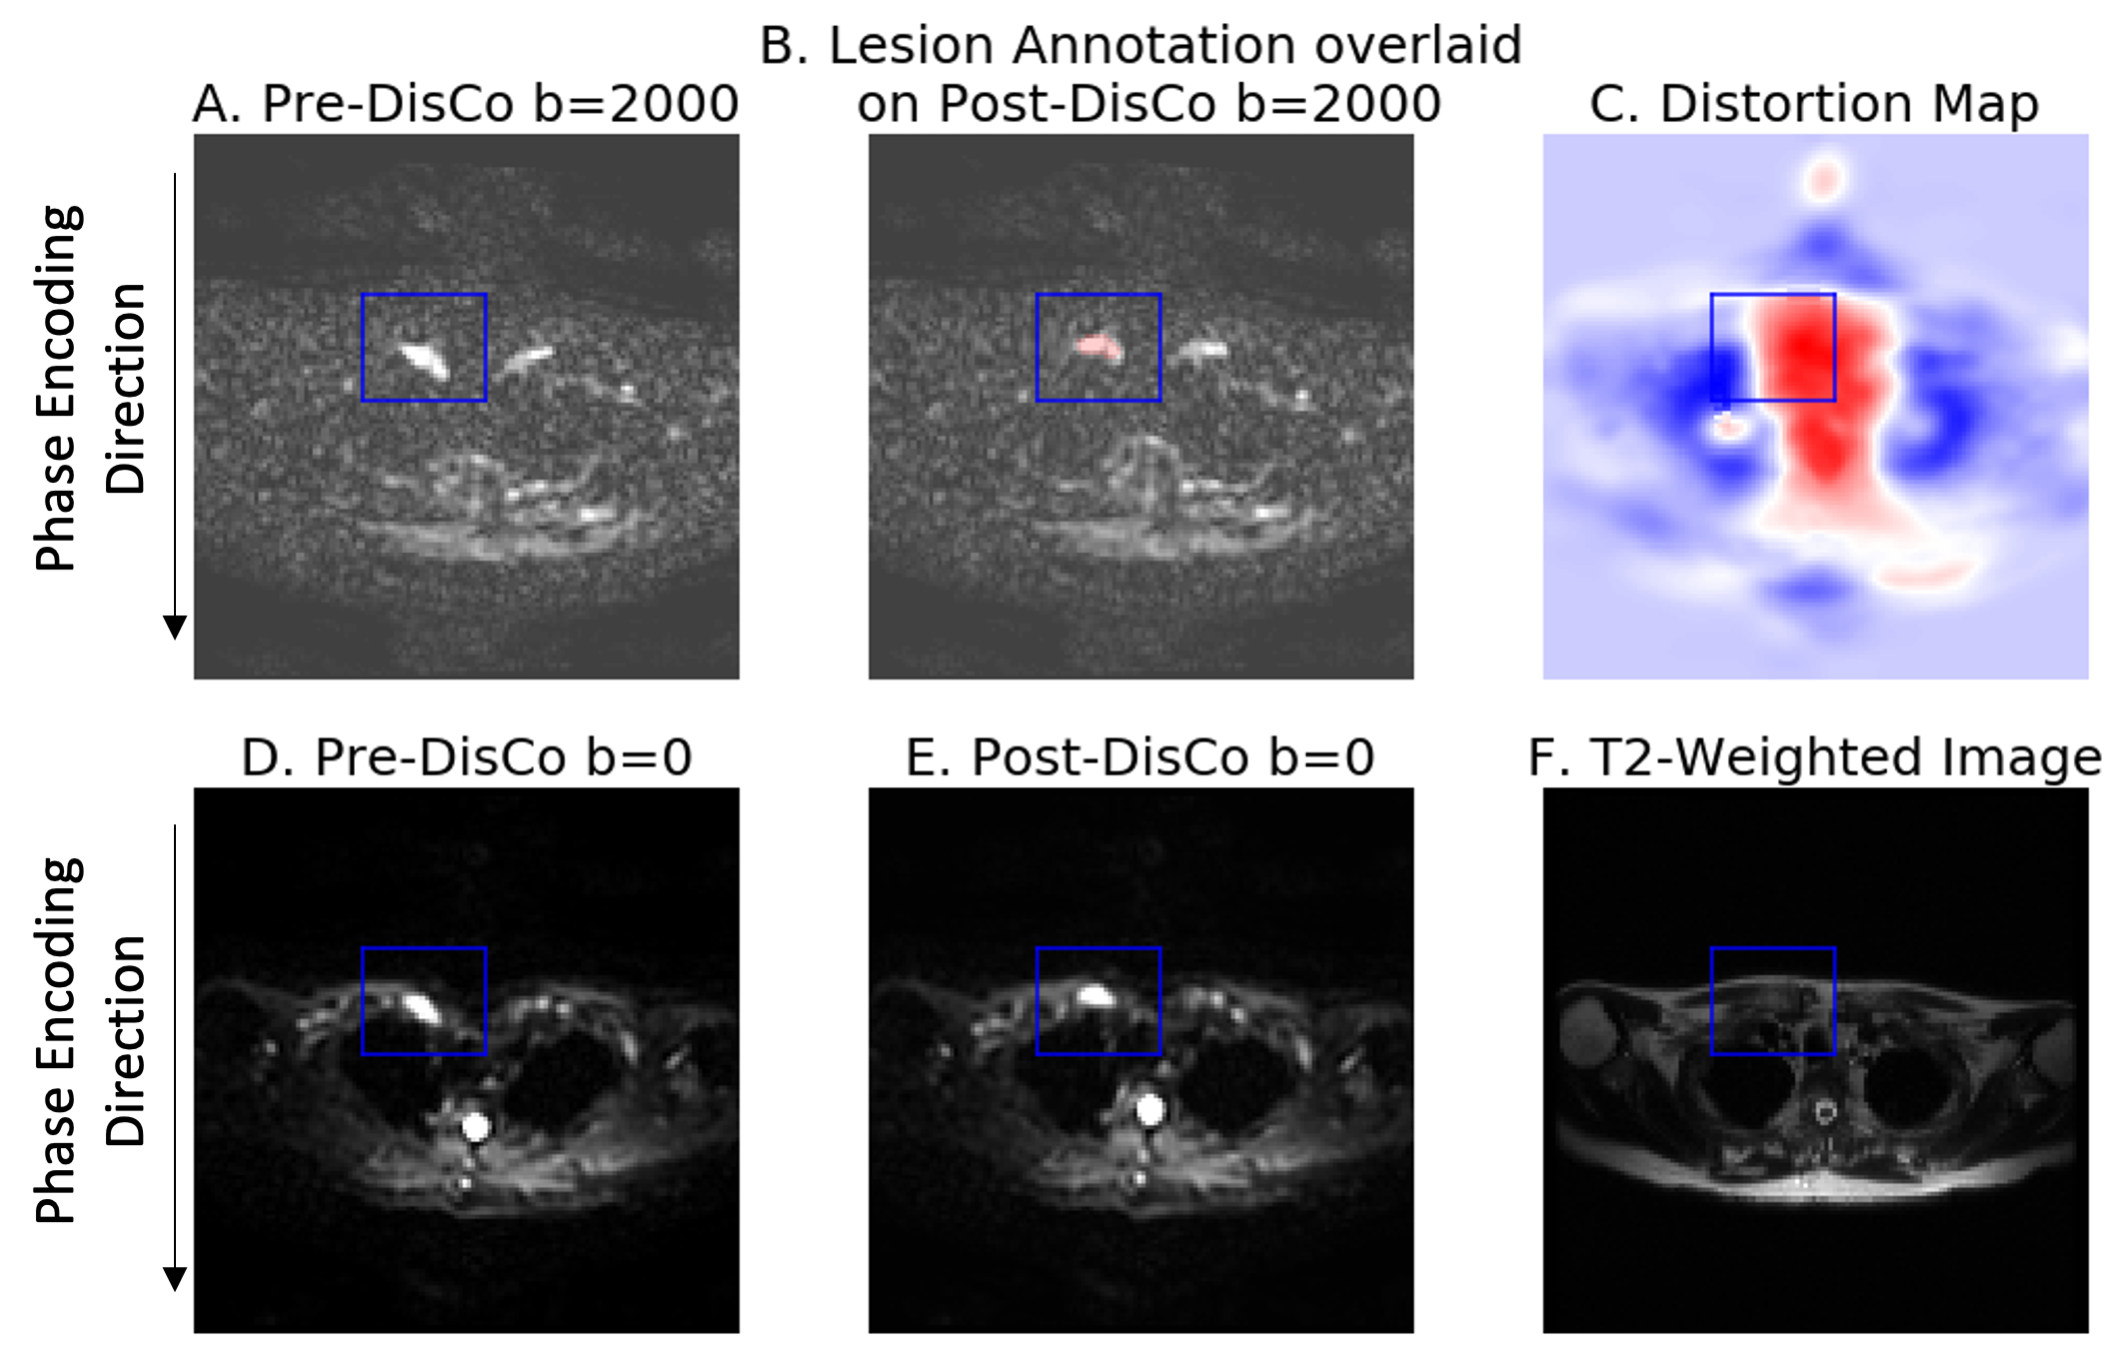
Figure 1. Example bone metastasis illustrating B0 inhomogeneity induced distortion on DWI. (A) Pre-DisCo DWI b=2000 s/mm2 (B) Lesion annotation (pink) overlaid on post-DisCo DWI b=2000 s/mm2 (C) Distortion map; voxel values represent extent of displacement at each voxel. Red and blue values denote displacement in the posterior and anterior direction, respectively. (D) Pre-DisCo DWI b=0 s/mm2 (E) Post-DisCo DWI b=0 s/mm2. F. T2-weighted image. In each subfigure, bounding box was drawn 10 voxels from the lateral edge of the lesion. Abbreviations: DisCo=distortion correction.
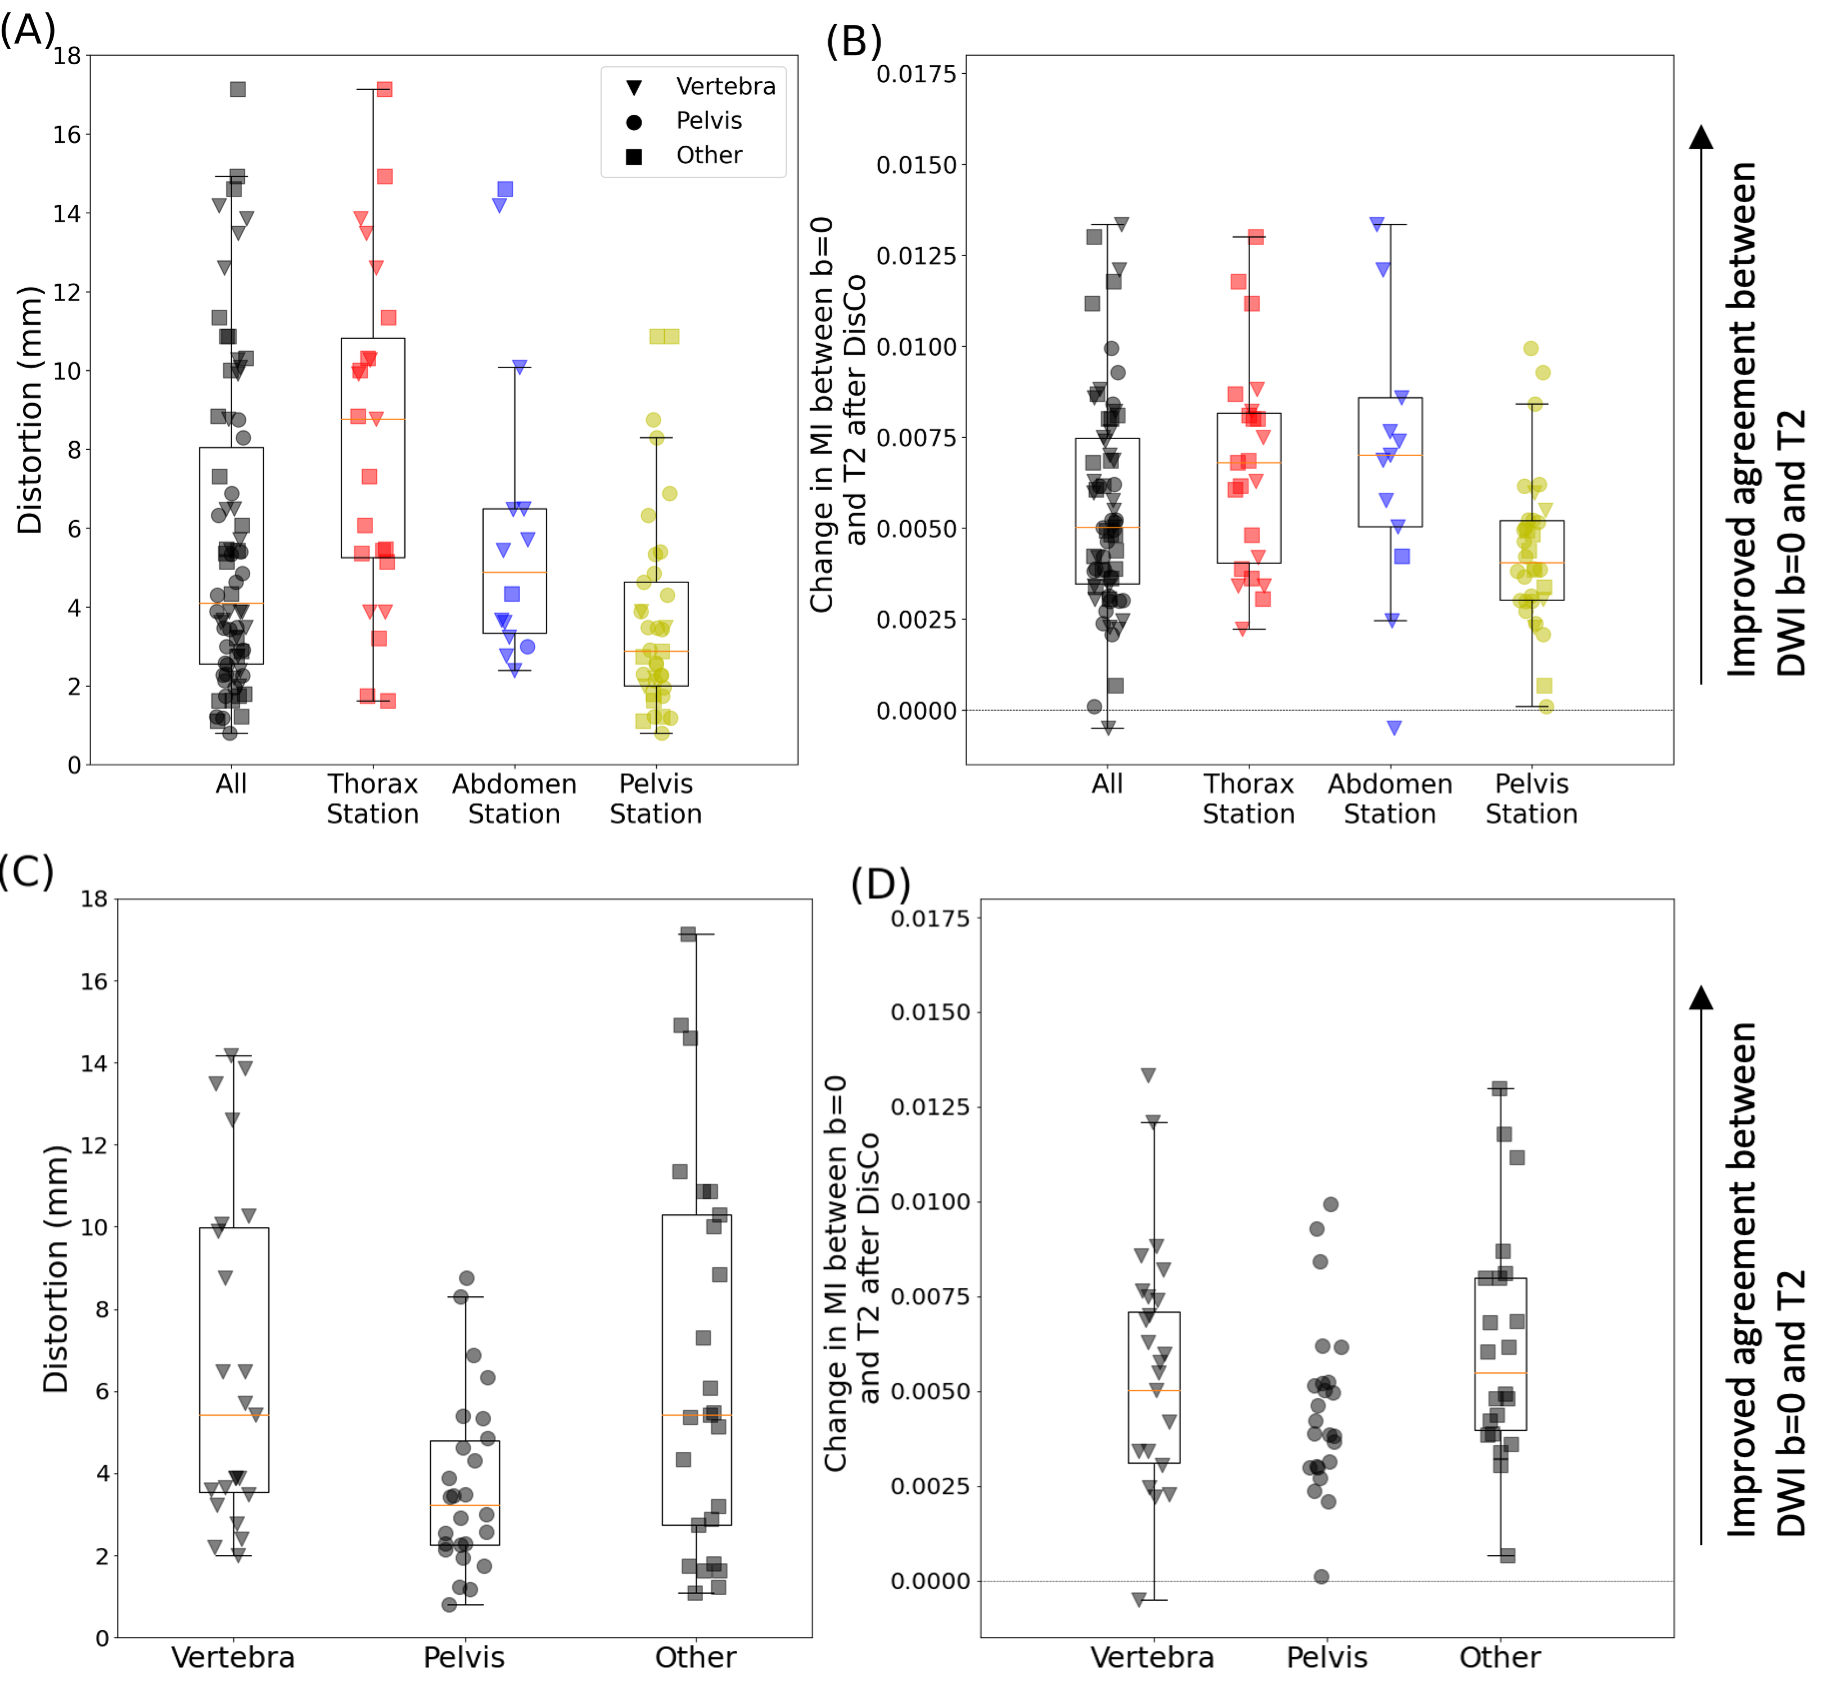
Figure 3. Distribution of RMS distortion and MI between b=0 s/mm2 and T2-weighted images. (A) RMS distortion for all lesions (black) as well as the distribution within specific imaging stations. (B) Change in MI values between the b=0 s/mm2 and T2 images after DisCo. A value larger than 0 indicates improved agreement between b=0 and T2 images. (C) RMS distortion for lesions broken down by anatomic group. (D) Change in MI values after DisCo by anatomic group. Abbreviations: RMS=root mean square, MI=mutual information.