Osamu Togao1, Akio Hiwatashi2, Toru Chikui3, Kazufumi Kikuchi2, Yukiko Kami3, Kenji Tokumori4, and Kousei Ishigami2
1Molecular Imaging & Diagnosis, Kyushu University, Fukuoka, Japan, 2Clinical Radiology, Kyushu University, Fukuoka, Japan, 3Oral and Maxillofacial Radiology, Kyushu University, Fukuoka, Japan, 4Clinical Radiology, Teikyo University, Omuta, Japan
1Molecular Imaging & Diagnosis, Kyushu University, Fukuoka, Japan, 2Clinical Radiology, Kyushu University, Fukuoka, Japan, 3Oral and Maxillofacial Radiology, Kyushu University, Fukuoka, Japan, 4Clinical Radiology, Teikyo University, Omuta, Japan
The gamma distribution (GD) model analysis revealed that the κ, f2, and f3 values were smaller and the f1 values were larger in the primary CNS lymphomas than in the glioblastomas. The GD model may contribute to the characterization of brain tumor from the histological viewpoint.
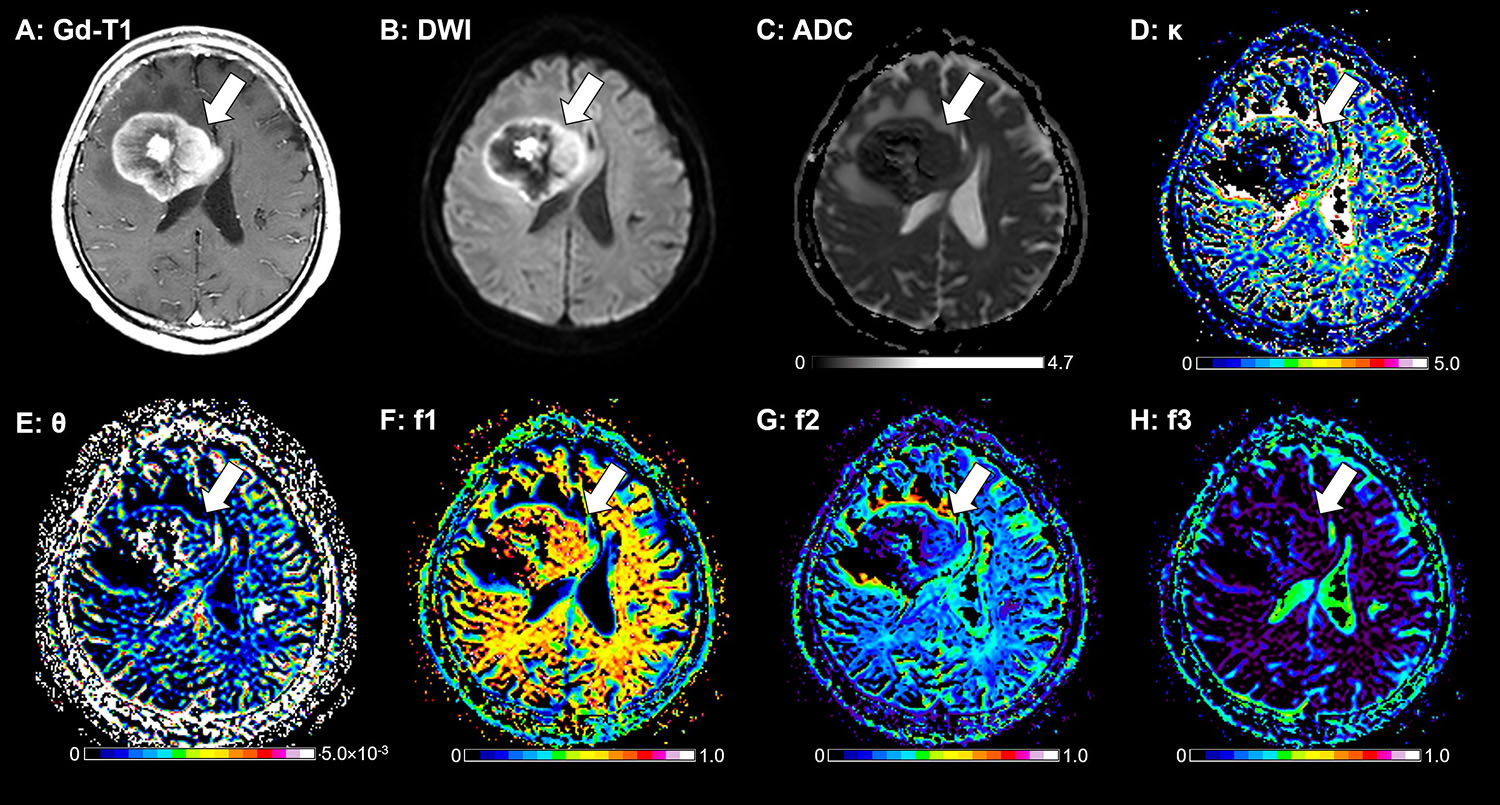
Figure 2. A 62-year-old-male with a PCNSL. A: The post-contrast T1-weighted image shows a ring-like enhancing mass lesion in the right frontal lobe (arrow). The enhancing lesion shows high signal intensity on the DWI (B) and a low ADC (0.70×10⁻³ mm2/sec, C). This lesion shows a small κ (1.76, D), a large θ (4.85×10⁻⁶ mm2/sec, E), a large f1 (0.626, F), a small f2 (0.270, G), and a small f3 (0.104, H).
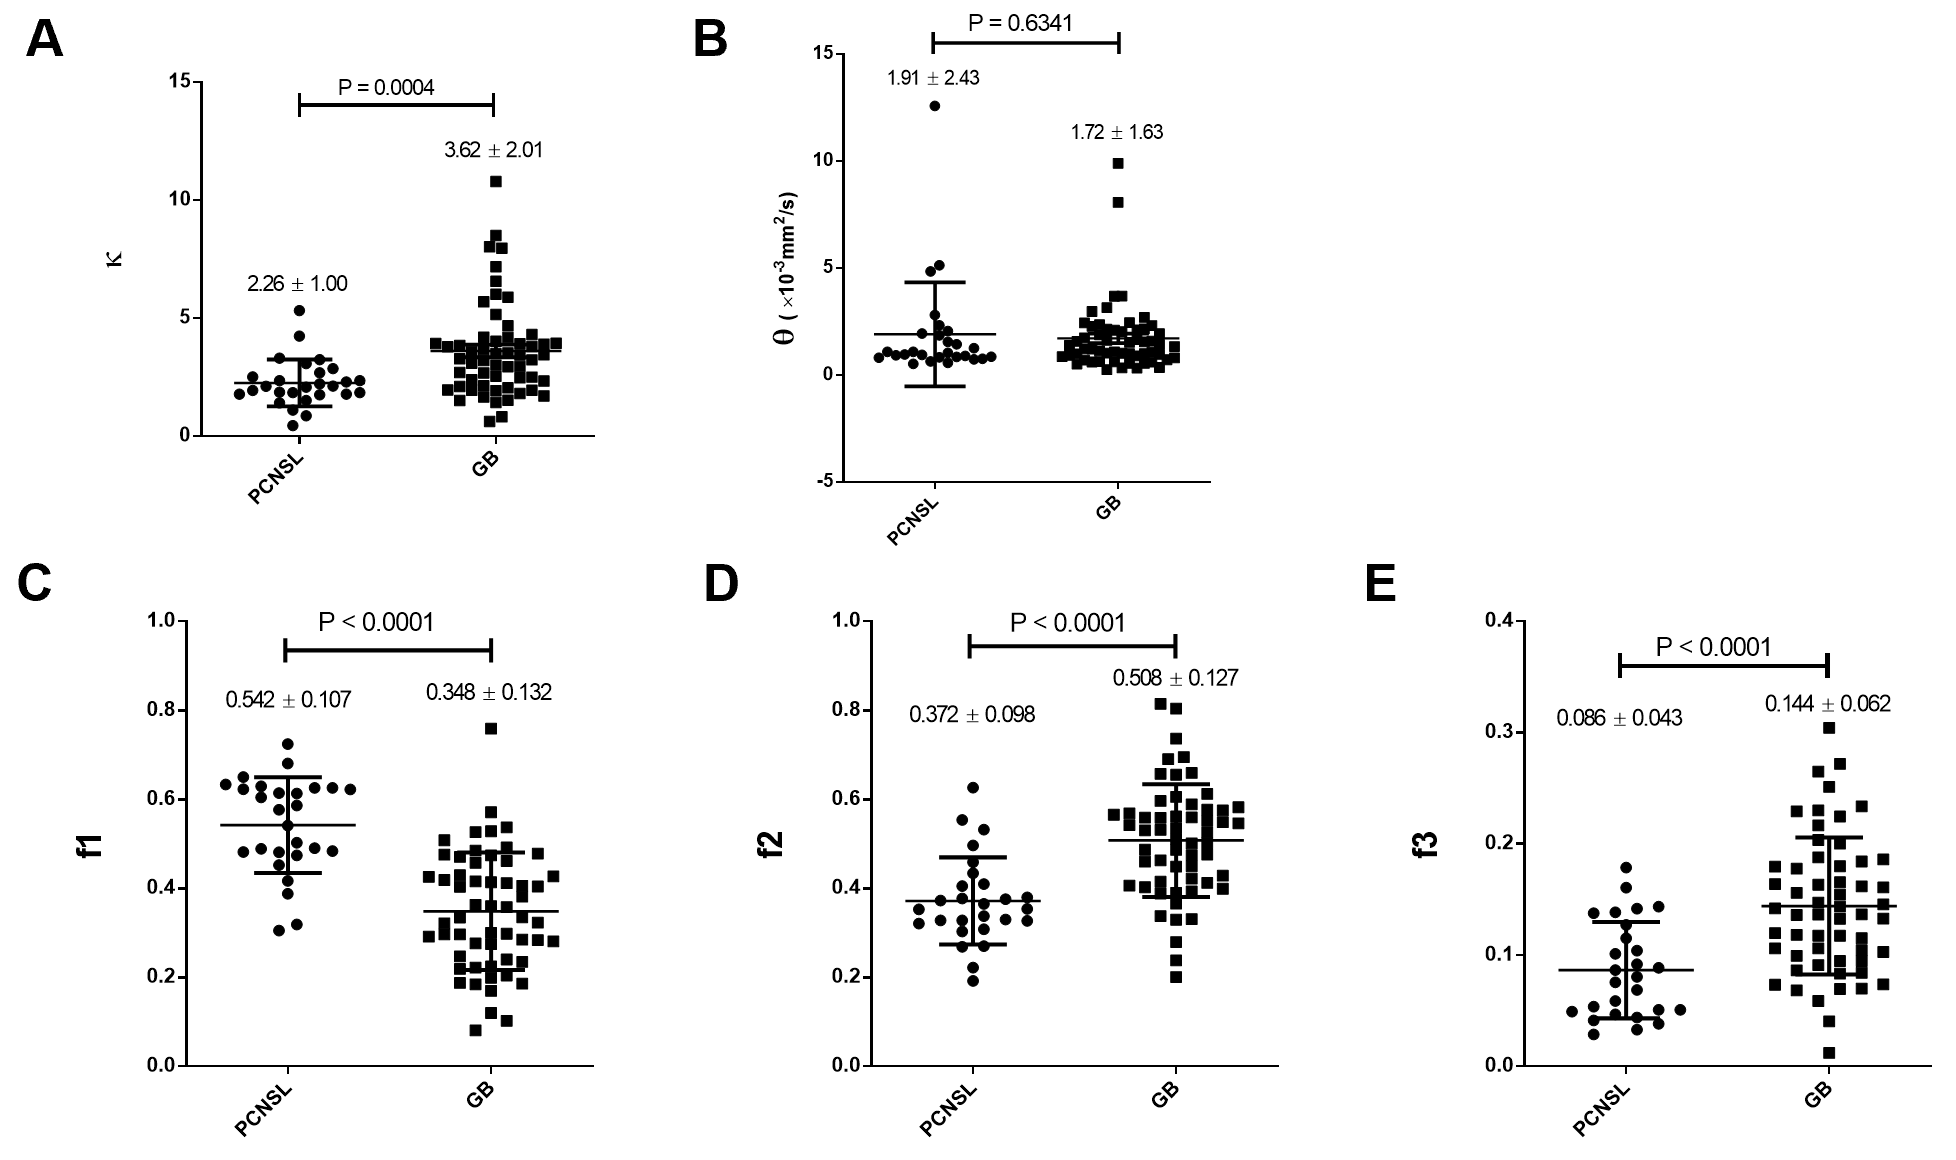
Figure 1. Comparisons of the GD model-derived parameters between the PCNSLs and GBs in the gadolinium-enhancing lesion. A: The κ was significantly smaller in the PCNSL group than in the GB group. B: The θ was not significantly different between the groups. C–E: The f1 was significantly larger and the f2 and f3 were significantly smaller in the PCNSL group than in the GB group.