Qingqing Wen1, Kang Wang2, Wenqi Wang1, Yi Sun3, Dan Wu1,2, and Yi Zhang1,2
1Key Laboratory for Biomedical Engineering of Ministry of Education, Department of Biomedical Engineering, College of Biomedical Engineering & Instrument Science, Zhejiang University, Hangzhou, China, 2Department of Neurology, First Affiliated Hospital, College of Medicine, Zhejiang University, Hangzhou, China, 3MR Collaboration, Siemens Healthcare Ltd., Shanghai, China
1Key Laboratory for Biomedical Engineering of Ministry of Education, Department of Biomedical Engineering, College of Biomedical Engineering & Instrument Science, Zhejiang University, Hangzhou, China, 2Department of Neurology, First Affiliated Hospital, College of Medicine, Zhejiang University, Hangzhou, China, 3MR Collaboration, Siemens Healthcare Ltd., Shanghai, China
Automated CEST measurements
in the hippocampus and amygdala at 3T can improve the diagnostic accuracy for
the seizure lateralization of TLE patients, compared with conventional quantitative
T1 and T2 mapping.

Figure 4.
Coronal
slices of the reconstructed T1w images (A, E), mean MTRasym
maps within 2-4 ppm (B, F), T1 maps (C, G), and T2 maps
(D, H) of a left TLE patient (first row) and a right TLE patient (second row). The
MTRasym values were higher in the epileptogenic hippocampus and
amygdala (HA, illustrated by red boxes) than those in the contralateral HA.
However, T1 and T2 values in the HA ipsilateral to the
seizure were similar to or even lower than those in the contralateral HA (D, G,
and H).
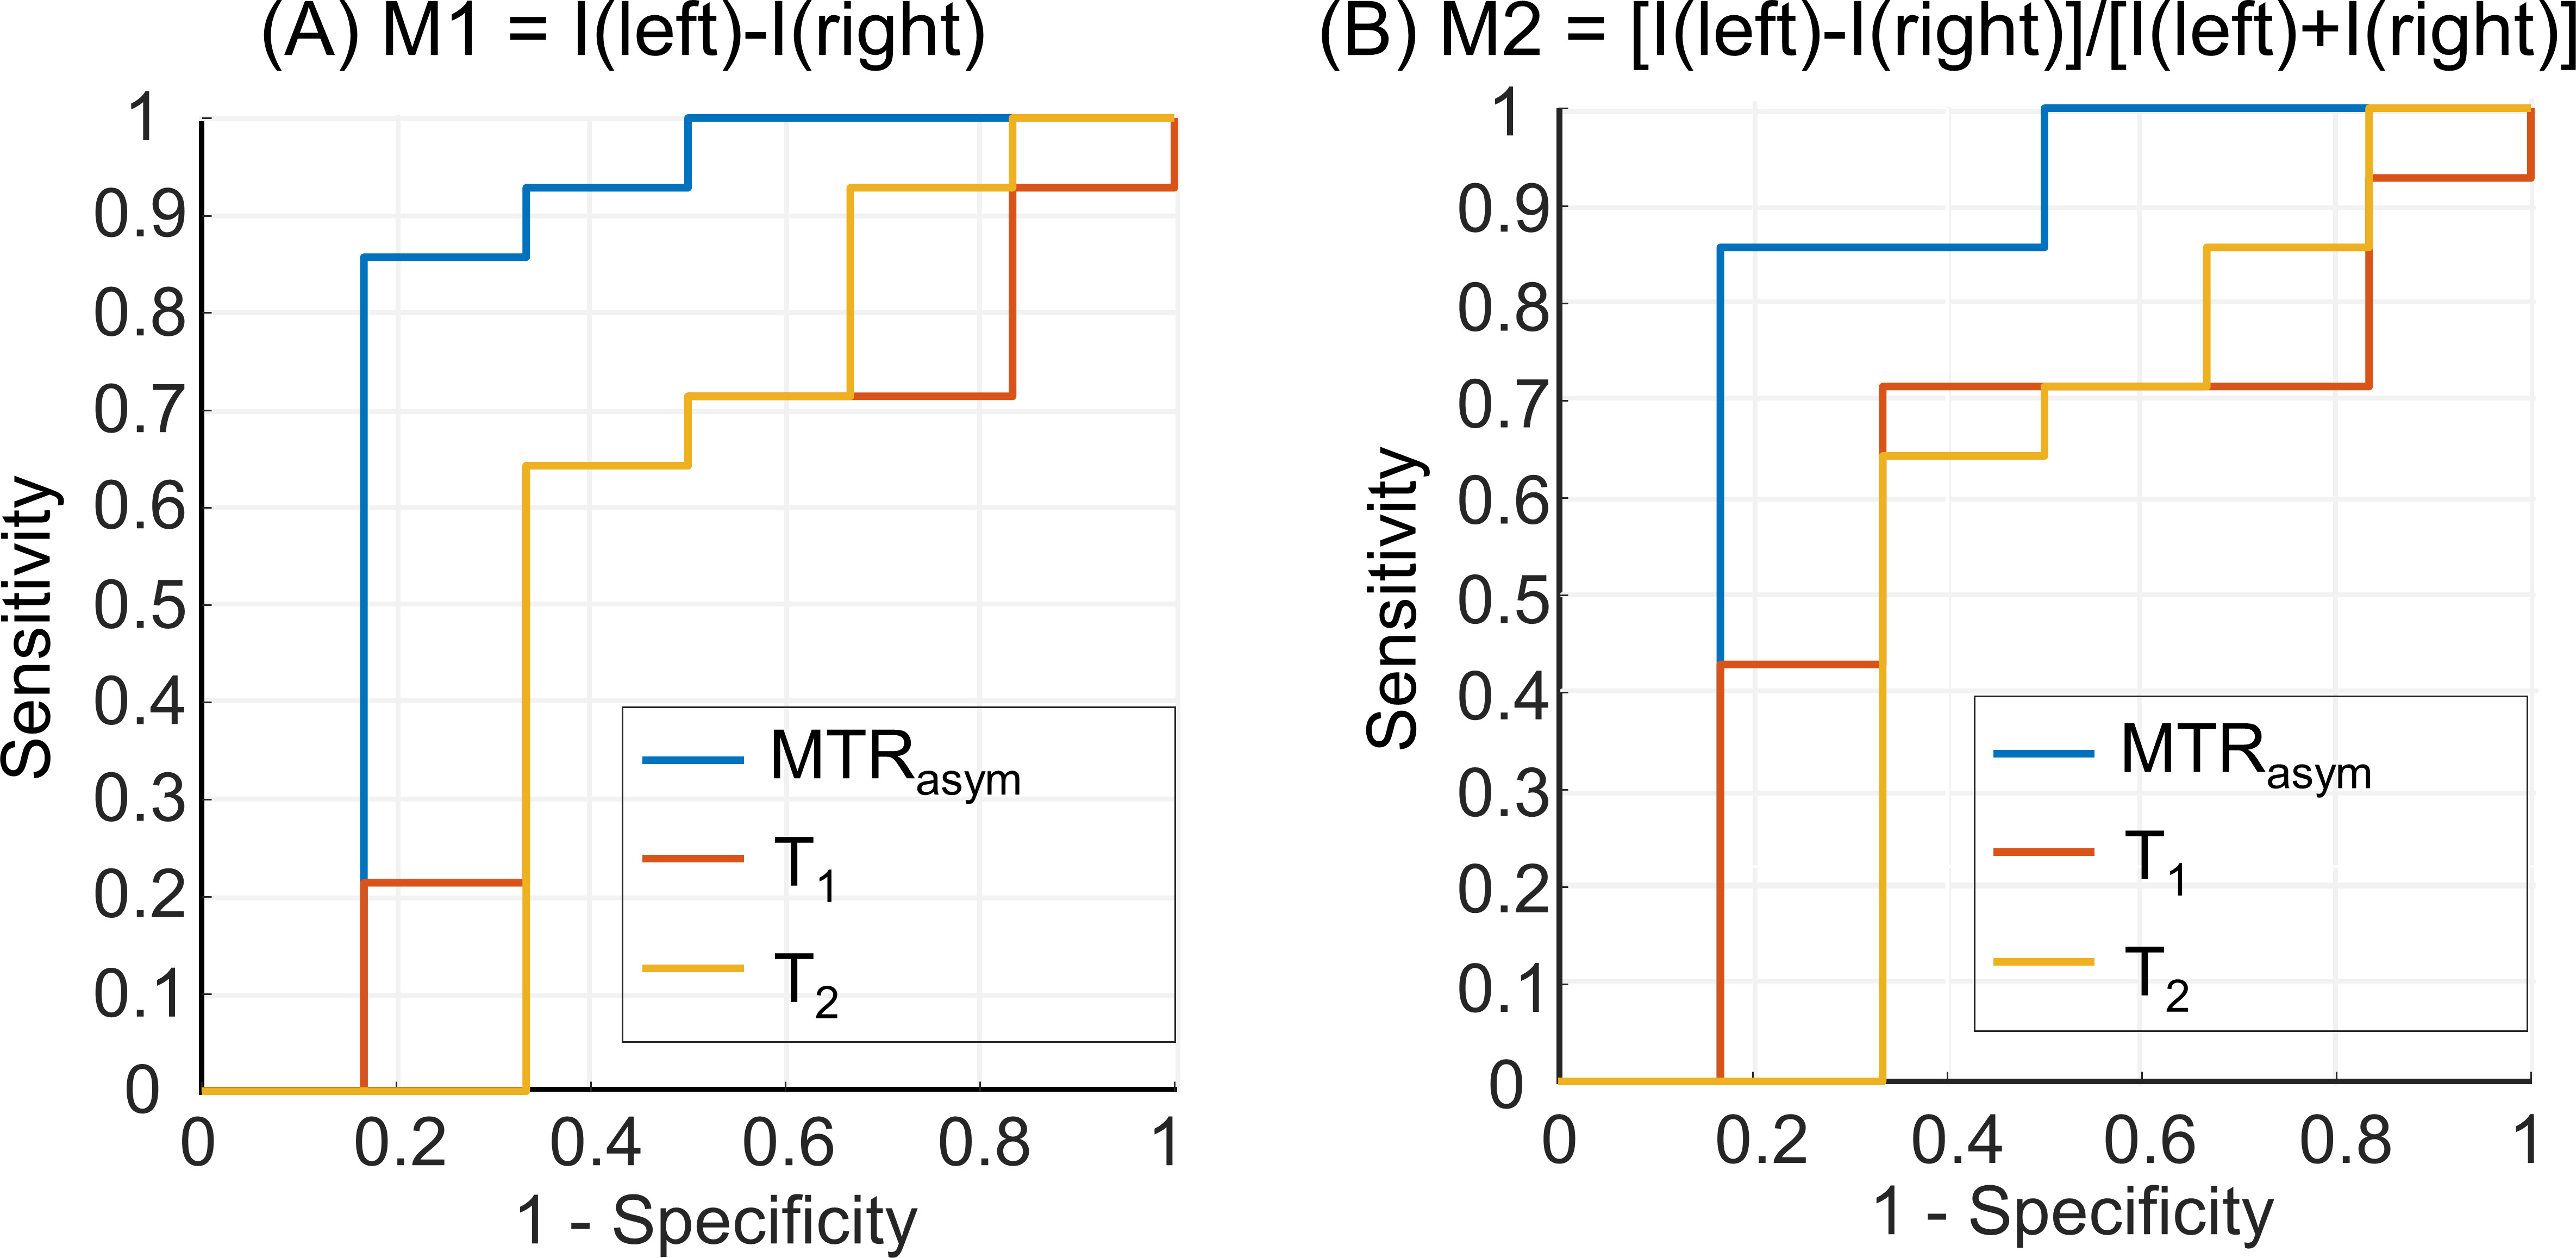
Figure 3. ROC curves for the lateralization
of epileptic foci using metric1 (A) and metric2 (B). The two metrics used MTRasym
(blue line), T1 (red line), and T2 (yellow line) values as
input indices. For both of these two metrics, AUC values of the MTRasym
index were significantly higher than those of T1 and T2.